29
/
en
AIzaSyAYiBZKx7MnpbEhh9jyipgxe19OcubqV5w
April 1, 2024
158757
Iraq
IRQ
true
2
1
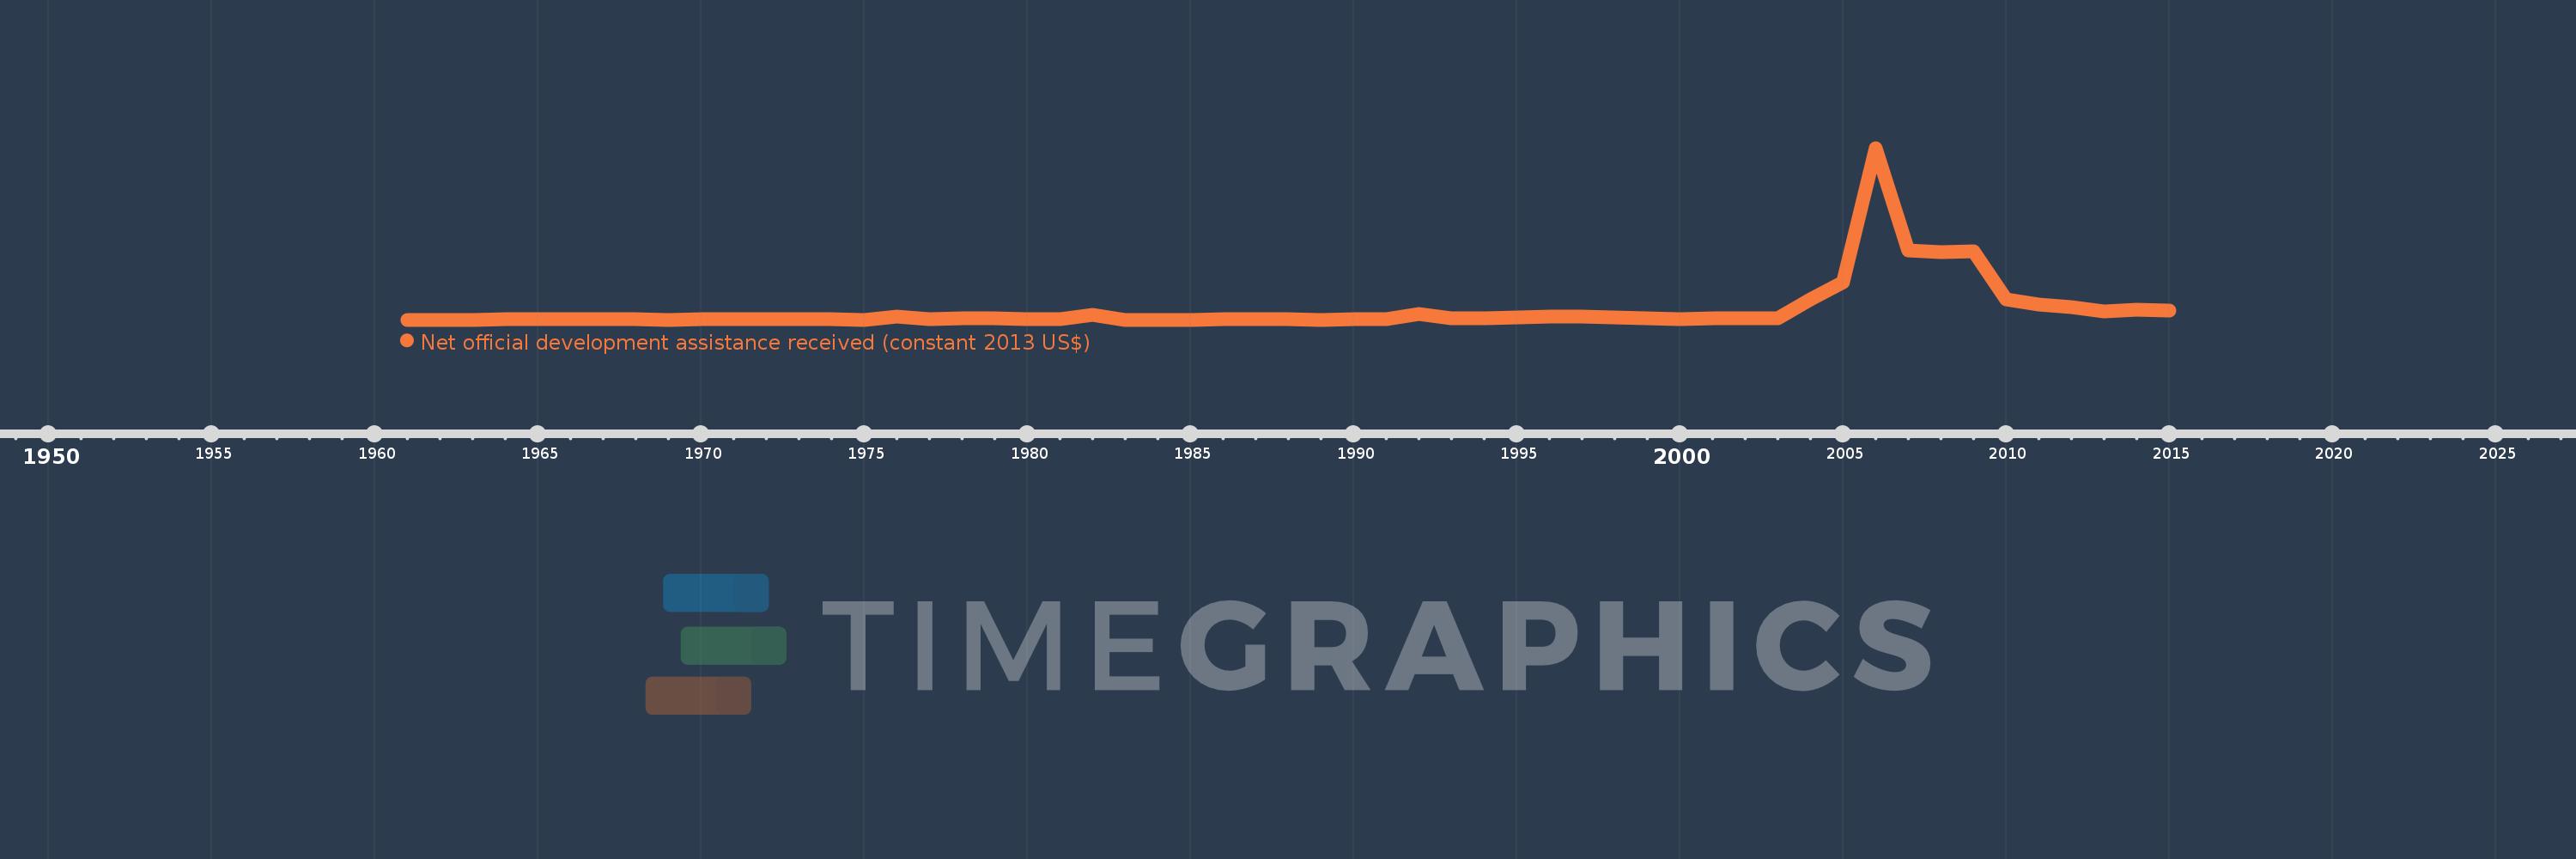
Net official development assistance received (constant 2013 US$)
2015,2014,2013,2012,2011,2010,2009,2008,2007,2006,2005,2004,2003,2002,2001,2000,1999,1998,1997,1996,1995,1994,1993,1992,1991,1990,1989,1988,1987,1986,1985,1984,1983,1982,1981,1980,1979,1978,1977,1976,1975,1974,1973,1972,1971,1970,1969,1968,1967,1966,1965,1964,1963,1962,1961
This statistics in other country:
AfghanistanAlbaniaAlgeriaAngolaAntigua and BarbudaArab WorldArgentinaArmeniaArubaAzerbaijanBahamas, TheBahrainBangladeshBarbadosBelarusBelizeBeninBermudaBhutanBoliviaBosnia and HerzegovinaBotswanaBrazilBritish Virgin IslandsBrunei DarussalamBurkina FasoBurundiCabo VerdeCambodiaCameroonCaribbean small statesCayman IslandsCentral African RepublicCentral Europe and the BalticsChadChileChinaColombiaComorosCongo, Dem. Rep.Congo, Rep.Costa RicaCote d'IvoireCroatiaCubaCyprusDjiboutiDominicaDominican RepublicEast Asia & PacificEast Asia & Pacific (excluding high income)East Asia & Pacific (IDA & IBRD countries)EcuadorEgypt, Arab Rep.El SalvadorEquatorial GuineaEritreaEthiopiaEuro areaEurope & Central AsiaEurope & Central Asia (excluding high income)Europe & Central Asia (IDA & IBRD countries)European UnionFijiFragile and conflict affected situationsFrench PolynesiaGabonGambia, TheGeorgiaGhanaGibraltarGrenadaGuatemalaGuineaGuinea-BissauGuyanaHaitiHeavily indebted poor countries (HIPC)High incomeHondurasHong Kong SAR, ChinaIBRD onlyIDA & IBRD totalIDA blendIDA onlyIDA totalIndiaIndonesiaIran, Islamic Rep.IraqIsraelJamaicaJordanKazakhstanKenyaKiribatiKorea, Dem. People’s Rep.Korea, Rep.KosovoKuwaitKyrgyz RepublicLao PDRLatin America & Caribbean Latin America & Caribbean (excluding high income)Latin America & the Caribbean (IDA & IBRD countries)Least developed countries: UN classificationLebanonLesothoLiberiaLibyaLow & middle incomeLow incomeLower middle incomeMacao SAR, ChinaMacedonia, FYRMadagascarMalawiMalaysiaMaldivesMaliMaltaMarshall IslandsMauritaniaMauritiusMexicoMicronesia, Fed. Sts.Middle East & North AfricaMiddle East & North Africa (excluding high income)Middle East & North Africa (IDA & IBRD countries)Middle incomeMoldovaMongoliaMontenegroMoroccoMozambiqueMyanmarNamibiaNauruNepalNew CaledoniaNicaraguaNigerNigeriaNorth AmericaNorthern Mariana IslandsOECD membersOmanOther small statesPacific island small statesPakistanPalauPanamaPapua New GuineaParaguayPeruPhilippinesQatarRwandaSamoaSao Tome and PrincipeSaudi ArabiaSenegalSerbiaSeychellesSierra LeoneSingaporeSloveniaSmall statesSolomon IslandsSomaliaSouth AfricaSouth AsiaSouth Asia (IDA & IBRD)South SudanSri LankaSt. Kitts and NevisSt. LuciaSt. Vincent and the GrenadinesSub-Saharan Africa Sub-Saharan Africa (excluding high income)Sub-Saharan Africa (IDA & IBRD countries)SudanSurinameSwazilandSyrian Arab RepublicTajikistanTanzaniaThailandTimor-LesteTogoTongaTrinidad and TobagoTunisiaTurkeyTurkmenistanTurks and Caicos IslandsTuvaluUgandaUkraineUnited Arab EmiratesUpper middle incomeUruguayUzbekistanVanuatuVenezuela, RBVietnamWest Bank and GazaWorldYemen, Rep.ZambiaZimbabwe Timeline:
This timeline shows a graph from 1961 to 2015 of Iraq. No data until 1960. Number of actual observations by date: 55.
Source name:
World Development Indicators
Source organization:
Development Assistance Committee of the Organisation for Economic Co-operation and Development, Geographical Distribution of Financial Flows to Developing Countries, Development Co-operation Report, and International Development Statistics database. Data are available online at: www.oecd.org/dac/stats/idsonline.
Categories, topics:
Aid Effectiveness
Last updated:
apr 23, 2017
Indicators value changes by year
Minimum:
-1.21 mln
jan 1, 1985
Maximum:
25.33 bln
jan 1, 2006
At the date of observation
Value
Absolute change
Change from previous value
jan 1, 1961
10.09 mln
+10.09 mln
0.0%
jan 1, 1962
5.47 mln
-4.62 mln
-45.79%
jan 1, 1963
15.47 mln
+10.0 mln
182.82%
jan 1, 1964
32.05 mln
+16.58 mln
107.18%
jan 1, 1965
73.61 mln
+41.56 mln
129.67%
jan 1, 1966
77.62 mln
+4.01 mln
5.45%
jan 1, 1967
27.39 mln
-50.23 mln
-64.71%
jan 1, 1968
25.19 mln
-2.2 mln
-8.03%
jan 1, 1969
18.49 mln
-6.7 mln
-26.6%
jan 1, 1970
31.58 mln
+13.09 mln
70.8%
jan 1, 1971
47.82 mln
+16.24 mln
51.42%
jan 1, 1972
86.06 mln
+38.24 mln
79.97%
jan 1, 1973
116.39 mln
+30.33 mln
35.24%
jan 1, 1974
67.33 mln
-49.06 mln
-42.15%
jan 1, 1975
19.24 mln
-48.09 mln
-71.42%
jan 1, 1976
426.72 mln
+407.48 mln
2.12K%
jan 1, 1977
75.65 mln
-351.07 mln
-82.27%
jan 1, 1978
258.24 mln
+182.59 mln
241.36%
jan 1, 1979
194.88 mln
-63.36 mln
-24.54%
jan 1, 1980
74.32 mln
-120.56 mln
-61.86%
jan 1, 1981
29.15 mln
-45.17 mln
-60.78%
jan 1, 1982
665.17 mln
+636.02 mln
2.18K%
jan 1, 1983
11.27 mln
-653.9 mln
-98.31%
jan 1, 1984
18.59 mln
+7.32 mln
64.95%
jan 1, 1985
-1.21 mln
-19.8 mln
-106.51%
jan 1, 1986
50.07 mln
+51.28 mln
-4.24K%
jan 1, 1987
52.42 mln
+2.35 mln
4.69%
jan 1, 1988
124.35 mln
+71.93 mln
137.22%
jan 1, 1989
17.92 mln
-106.43 mln
-85.59%
jan 1, 1990
27.61 mln
+9.69 mln
54.07%
jan 1, 1991
104.25 mln
+76.64 mln
277.58%
jan 1, 1992
849.53 mln
+745.28 mln
714.9%
jan 1, 1993
204.48 mln
-645.05 mln
-75.93%
jan 1, 1994
263.06 mln
+58.58 mln
28.65%
jan 1, 1995
377.23 mln
+114.17 mln
43.4%
jan 1, 1996
463.31 mln
+86.08 mln
22.82%
jan 1, 1997
471.62 mln
+8.31 mln
1.79%
jan 1, 1998
335.53 mln
-136.09 mln
-28.86%
jan 1, 1999
188.18 mln
-147.35 mln
-43.92%
jan 1, 2000
139.83 mln
-48.35 mln
-25.69%
jan 1, 2001
181.23 mln
+41.4 mln
29.61%
jan 1, 2002
218.91 mln
+37.68 mln
20.79%
jan 1, 2003
194.52 mln
-24.39 mln
-11.14%
jan 1, 2004
2.984 bln
+2.789 bln
1.43K%
jan 1, 2005
5.475 bln
+2.491 bln
83.49%
jan 1, 2006
25.33 bln
+19.855 bln
362.63%
jan 1, 2007
10.24 bln
-15.09 bln
-59.58%
jan 1, 2008
9.997 bln
-243.15 mln
-2.37%
jan 1, 2009
10.121 bln
+124.22 mln
1.24%
jan 1, 2010
2.989 bln
-7.132 bln
-70.47%
jan 1, 2011
2.271 bln
-717.92 mln
-24.02%
jan 1, 2012
1.881 bln
-390.62 mln
-17.2%
jan 1, 2013
1.25 bln
-630.89 mln
-33.55%
jan 1, 2014
1.541 bln
+291.09 mln
23.29%
jan 1, 2015
1.389 bln
-151.88 mln
-9.86%
Ranking of countries by current statistics by years


Comments: