29
/
en
AIzaSyAYiBZKx7MnpbEhh9jyipgxe19OcubqV5w
April 1, 2024
223982
Philippines
PHL
true
2
1
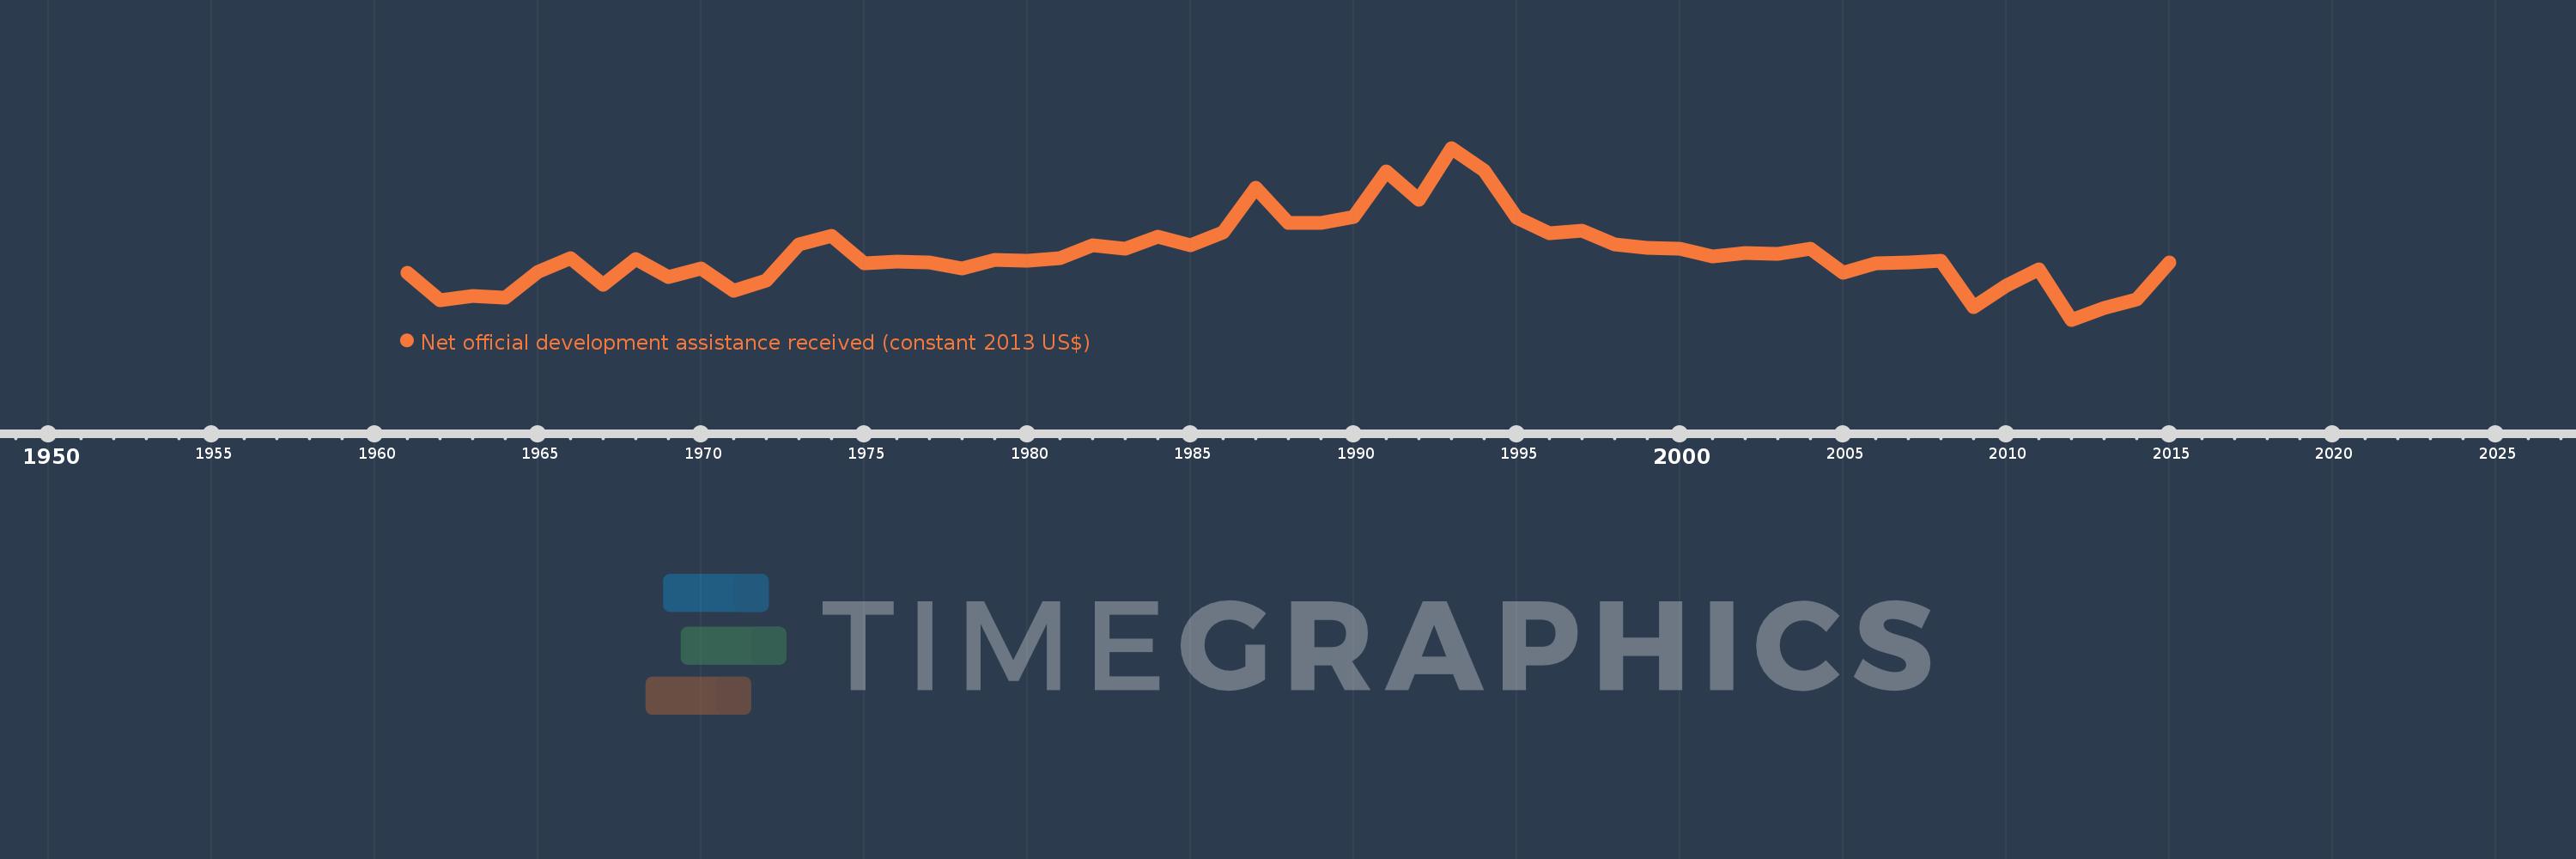
Net official development assistance received (constant 2013 US$)
2015,2014,2013,2012,2011,2010,2009,2008,2007,2006,2005,2004,2003,2002,2001,2000,1999,1998,1997,1996,1995,1994,1993,1992,1991,1990,1989,1988,1987,1986,1985,1984,1983,1982,1981,1980,1979,1978,1977,1976,1975,1974,1973,1972,1971,1970,1969,1968,1967,1966,1965,1964,1963,1962,1961
This statistics in other country:
AfghanistanAlbaniaAlgeriaAngolaAntigua and BarbudaArab WorldArgentinaArmeniaArubaAzerbaijanBahamas, TheBahrainBangladeshBarbadosBelarusBelizeBeninBermudaBhutanBoliviaBosnia and HerzegovinaBotswanaBrazilBritish Virgin IslandsBrunei DarussalamBurkina FasoBurundiCabo VerdeCambodiaCameroonCaribbean small statesCayman IslandsCentral African RepublicCentral Europe and the BalticsChadChileChinaColombiaComorosCongo, Dem. Rep.Congo, Rep.Costa RicaCote d'IvoireCroatiaCubaCyprusDjiboutiDominicaDominican RepublicEast Asia & PacificEast Asia & Pacific (excluding high income)East Asia & Pacific (IDA & IBRD countries)EcuadorEgypt, Arab Rep.El SalvadorEquatorial GuineaEritreaEthiopiaEuro areaEurope & Central AsiaEurope & Central Asia (excluding high income)Europe & Central Asia (IDA & IBRD countries)European UnionFijiFragile and conflict affected situationsFrench PolynesiaGabonGambia, TheGeorgiaGhanaGibraltarGrenadaGuatemalaGuineaGuinea-BissauGuyanaHaitiHeavily indebted poor countries (HIPC)High incomeHondurasHong Kong SAR, ChinaIBRD onlyIDA & IBRD totalIDA blendIDA onlyIDA totalIndiaIndonesiaIran, Islamic Rep.IraqIsraelJamaicaJordanKazakhstanKenyaKiribatiKorea, Dem. People’s Rep.Korea, Rep.KosovoKuwaitKyrgyz RepublicLao PDRLatin America & Caribbean Latin America & Caribbean (excluding high income)Latin America & the Caribbean (IDA & IBRD countries)Least developed countries: UN classificationLebanonLesothoLiberiaLibyaLow & middle incomeLow incomeLower middle incomeMacao SAR, ChinaMacedonia, FYRMadagascarMalawiMalaysiaMaldivesMaliMaltaMarshall IslandsMauritaniaMauritiusMexicoMicronesia, Fed. Sts.Middle East & North AfricaMiddle East & North Africa (excluding high income)Middle East & North Africa (IDA & IBRD countries)Middle incomeMoldovaMongoliaMontenegroMoroccoMozambiqueMyanmarNamibiaNauruNepalNew CaledoniaNicaraguaNigerNigeriaNorth AmericaNorthern Mariana IslandsOECD membersOmanOther small statesPacific island small statesPakistanPalauPanamaPapua New GuineaParaguayPeruPhilippinesQatarRwandaSamoaSao Tome and PrincipeSaudi ArabiaSenegalSerbiaSeychellesSierra LeoneSingaporeSloveniaSmall statesSolomon IslandsSomaliaSouth AfricaSouth AsiaSouth Asia (IDA & IBRD)South SudanSri LankaSt. Kitts and NevisSt. LuciaSt. Vincent and the GrenadinesSub-Saharan Africa Sub-Saharan Africa (excluding high income)Sub-Saharan Africa (IDA & IBRD countries)SudanSurinameSwazilandSyrian Arab RepublicTajikistanTanzaniaThailandTimor-LesteTogoTongaTrinidad and TobagoTunisiaTurkeyTurkmenistanTurks and Caicos IslandsTuvaluUgandaUkraineUnited Arab EmiratesUpper middle incomeUruguayUzbekistanVanuatuVenezuela, RBVietnamWest Bank and GazaWorldYemen, Rep.ZambiaZimbabwe Timeline:
This timeline shows a graph from 1961 to 2015 of Philippines. No data until 1960. Number of actual observations by date: 55.
Source name:
World Development Indicators
Source organization:
Development Assistance Committee of the Organisation for Economic Co-operation and Development, Geographical Distribution of Financial Flows to Developing Countries, Development Co-operation Report, and International Development Statistics database. Data are available online at: www.oecd.org/dac/stats/idsonline.
Categories, topics:
Aid Effectiveness
Last updated:
apr 23, 2017
Indicators value changes by year
Minimum:
-76.82 mln
jan 1, 2012
Maximum:
2.146 bln
jan 1, 1993
At the date of observation
Value
Absolute change
Change from previous value
jan 1, 1961
525.75 mln
+525.75 mln
0.0%
jan 1, 1962
174.61 mln
-351.14 mln
-66.79%
jan 1, 1963
226.4 mln
+51.79 mln
29.66%
jan 1, 1964
204.54 mln
-21.86 mln
-9.66%
jan 1, 1965
542.68 mln
+338.14 mln
165.32%
jan 1, 1966
721.52 mln
+178.84 mln
32.95%
jan 1, 1967
371.3 mln
-350.22 mln
-48.54%
jan 1, 1968
705.52 mln
+334.22 mln
90.01%
jan 1, 1969
478.79 mln
-226.73 mln
-32.14%
jan 1, 1970
582.38 mln
+103.59 mln
21.64%
jan 1, 1971
292.34 mln
-290.04 mln
-49.8%
jan 1, 1972
426.45 mln
+134.11 mln
45.87%
jan 1, 1973
898.22 mln
+471.77 mln
110.63%
jan 1, 1974
1.007 bln
+108.95 mln
12.13%
jan 1, 1975
650.81 mln
-356.36 mln
-35.38%
jan 1, 1976
675.98 mln
+25.17 mln
3.87%
jan 1, 1977
666.61 mln
-9.37 mln
-1.39%
jan 1, 1978
591.18 mln
-75.43 mln
-11.32%
jan 1, 1979
694.56 mln
+103.38 mln
17.49%
jan 1, 1980
692.06 mln
-2.5 mln
-0.36%
jan 1, 1981
717.39 mln
+25.33 mln
3.66%
jan 1, 1982
882.18 mln
+164.79 mln
22.97%
jan 1, 1983
839.08 mln
-43.1 mln
-4.89%
jan 1, 1984
999.57 mln
+160.49 mln
19.13%
jan 1, 1985
884.29 mln
-115.28 mln
-11.53%
jan 1, 1986
1.057 bln
+172.23 mln
19.48%
jan 1, 1987
1.63 bln
+573.61 mln
54.29%
jan 1, 1988
1.18 bln
-449.77 mln
-27.59%
jan 1, 1989
1.171 bln
-9.57 mln
-0.81%
jan 1, 1990
1.258 bln
+87.57 mln
7.48%
jan 1, 1991
1.848 bln
+589.58 mln
46.85%
jan 1, 1992
1.479 bln
-369.18 mln
-19.98%
jan 1, 1993
2.146 bln
+667.43 mln
45.13%
jan 1, 1994
1.855 bln
-291.67 mln
-13.59%
jan 1, 1995
1.237 bln
-617.33 mln
-33.29%
jan 1, 1996
1.044 bln
-192.7 mln
-15.58%
jan 1, 1997
1.078 bln
+33.55 mln
3.21%
jan 1, 1998
898.66 mln
-179.38 mln
-16.64%
jan 1, 1999
857.25 mln
-41.41 mln
-4.61%
jan 1, 2000
844.26 mln
-12.99 mln
-1.52%
jan 1, 2001
746.43 mln
-97.83 mln
-11.59%
jan 1, 2002
788.11 mln
+41.68 mln
5.58%
jan 1, 2003
771.21 mln
-16.9 mln
-2.14%
jan 1, 2004
846.84 mln
+75.63 mln
9.81%
jan 1, 2005
527.62 mln
-319.22 mln
-37.7%
jan 1, 2006
650.18 mln
+122.56 mln
23.23%
jan 1, 2007
661.83 mln
+11.65 mln
1.79%
jan 1, 2008
691.33 mln
+29.5 mln
4.46%
jan 1, 2009
81.89 mln
-609.44 mln
-88.15%
jan 1, 2010
367.47 mln
+285.58 mln
348.74%
jan 1, 2011
578.13 mln
+210.66 mln
57.33%
jan 1, 2012
-76.82 mln
-654.95 mln
-113.29%
jan 1, 2013
72.55 mln
+149.37 mln
-194.44%
jan 1, 2014
188.93 mln
+116.38 mln
160.41%
jan 1, 2015
670.07 mln
+481.14 mln
254.67%
Ranking of countries by current statistics by years


Comments: