29
/
en
AIzaSyAYiBZKx7MnpbEhh9jyipgxe19OcubqV5w
April 1, 2024
82092
Belgium
BEL
true
2
1
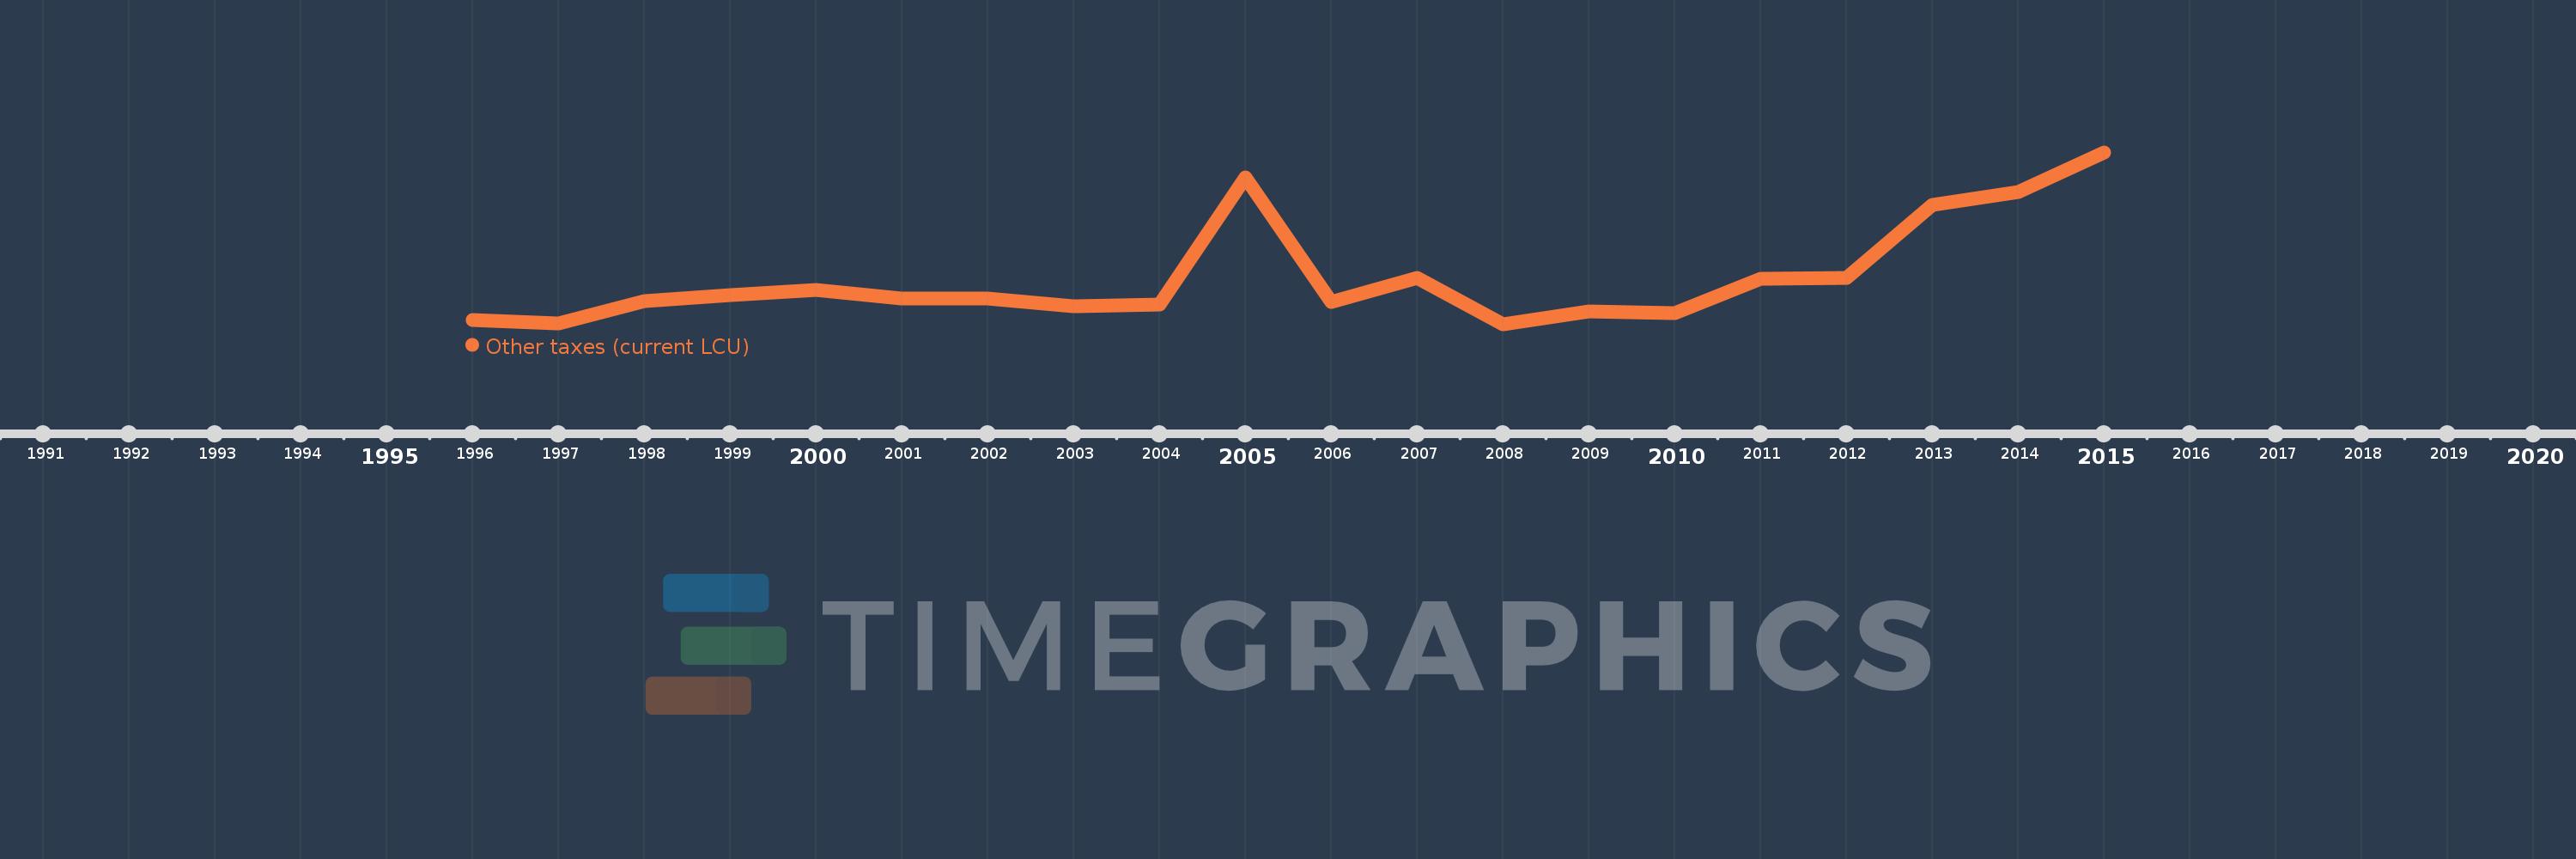
Other taxes (current LCU)
2015,2014,2013,2012,2011,2010,2009,2008,2007,2006,2005,2004,2003,2002,2001,2000,1999,1998,1997,1996
This statistics in other country:
AfghanistanAlbaniaAlgeriaAngolaAntigua and BarbudaArgentinaArmeniaAustraliaAustriaAzerbaijanBahamas, TheBahrainBangladeshBarbadosBelarusBelgiumBelizeBeninBhutanBoliviaBosnia and HerzegovinaBotswanaBrazilBulgariaBurkina FasoBurundiCabo VerdeCambodiaCentral African RepublicChileChinaColombiaCongo, Dem. Rep.Congo, Rep.Costa RicaCote d'IvoireCroatiaCyprusCzech RepublicDenmarkDominicaDominican RepublicEgypt, Arab Rep.El SalvadorEquatorial GuineaEstoniaEthiopiaFijiFinlandFranceGambia, TheGeorgiaGermanyGreeceGrenadaGuatemalaHondurasHong Kong SAR, ChinaHungaryIcelandIndiaIndonesiaIran, Islamic Rep.IraqIrelandIsraelItalyJamaicaJapanJordanKazakhstanKenyaKiribatiKorea, Rep.KuwaitKyrgyz RepublicLao PDRLatviaLebanonLesothoLiberiaLithuaniaLuxembourgMacao SAR, ChinaMacedonia, FYRMadagascarMalawiMalaysiaMaldivesMaliMaltaMauritiusMexicoMicronesia, Fed. Sts.MoldovaMongoliaMoroccoMozambiqueNamibiaNepalNetherlandsNew ZealandNicaraguaNorwayOmanPakistanPanamaPapua New GuineaParaguayPeruPhilippinesPolandPortugalRomaniaRussian FederationRwandaSamoaSan MarinoSao Tome and PrincipeSenegalSerbiaSeychellesSierra LeoneSingaporeSlovak RepublicSloveniaSolomon IslandsSouth AfricaSpainSri LankaSt. Kitts and NevisSt. LuciaSurinameSwazilandSwedenSwitzerlandSyrian Arab RepublicTajikistanTanzaniaThailandTimor-LesteTogoTrinidad and TobagoTunisiaTurkeyUgandaUkraineUnited KingdomUnited StatesUruguayVanuatuVenezuela, RBVietnamWest Bank and GazaYemen, Rep.ZambiaZimbabwe Timeline:
This timeline shows a graph from 1996 to 2015 of Belgium. No data until 1995. Number of actual observations by date: 20.
Source name:
World Development Indicators
Source organization:
International Monetary Fund, Government Finance Statistics Yearbook and data files.
Categories, topics:
Public Sector
Last updated:
apr 23, 2017
Indicators value changes by year
Minimum:
439.8 mln
jan 1, 2008
Maximum:
1.149 bln
jan 1, 2015
At the date of observation
Value
Absolute change
Change from previous value
jan 1, 1996
458.0 mln
+458.0 mln
0.0%
jan 1, 1997
443.5 mln
-14.5 mln
-3.17%
jan 1, 1998
536.3 mln
+92.8 mln
20.92%
jan 1, 1999
561.8 mln
+25.5 mln
4.75%
jan 1, 2000
582.7 mln
+20.9 mln
3.72%
jan 1, 2001
544.3 mln
-38.4 mln
-6.59%
jan 1, 2002
544.1 mln
-200.0K
-0.04%
jan 1, 2003
513.1 mln
-31.0 mln
-5.7%
jan 1, 2004
520.1 mln
+7.0 mln
1.36%
jan 1, 2005
1.045 bln
+525.1 mln
100.96%
jan 1, 2006
532.3 mln
-512.9 mln
-49.07%
jan 1, 2007
629.6 mln
+97.3 mln
18.28%
jan 1, 2008
439.8 mln
-189.8 mln
-30.15%
jan 1, 2009
491.1 mln
+51.3 mln
11.66%
jan 1, 2010
487.3 mln
-3.8 mln
-0.77%
jan 1, 2011
629.0 mln
+141.7 mln
29.08%
jan 1, 2012
630.2 mln
+1.2 mln
0.19%
jan 1, 2013
932.4 mln
+302.2 mln
47.95%
jan 1, 2014
984.6 mln
+52.2 mln
5.6%
jan 1, 2015
1.149 bln
+164.7 mln
16.73%
Ranking of countries by current statistics by years


Comments: