29
/
en
AIzaSyAYiBZKx7MnpbEhh9jyipgxe19OcubqV5w
April 1, 2024
68154
Angola
AGO
true
2
1
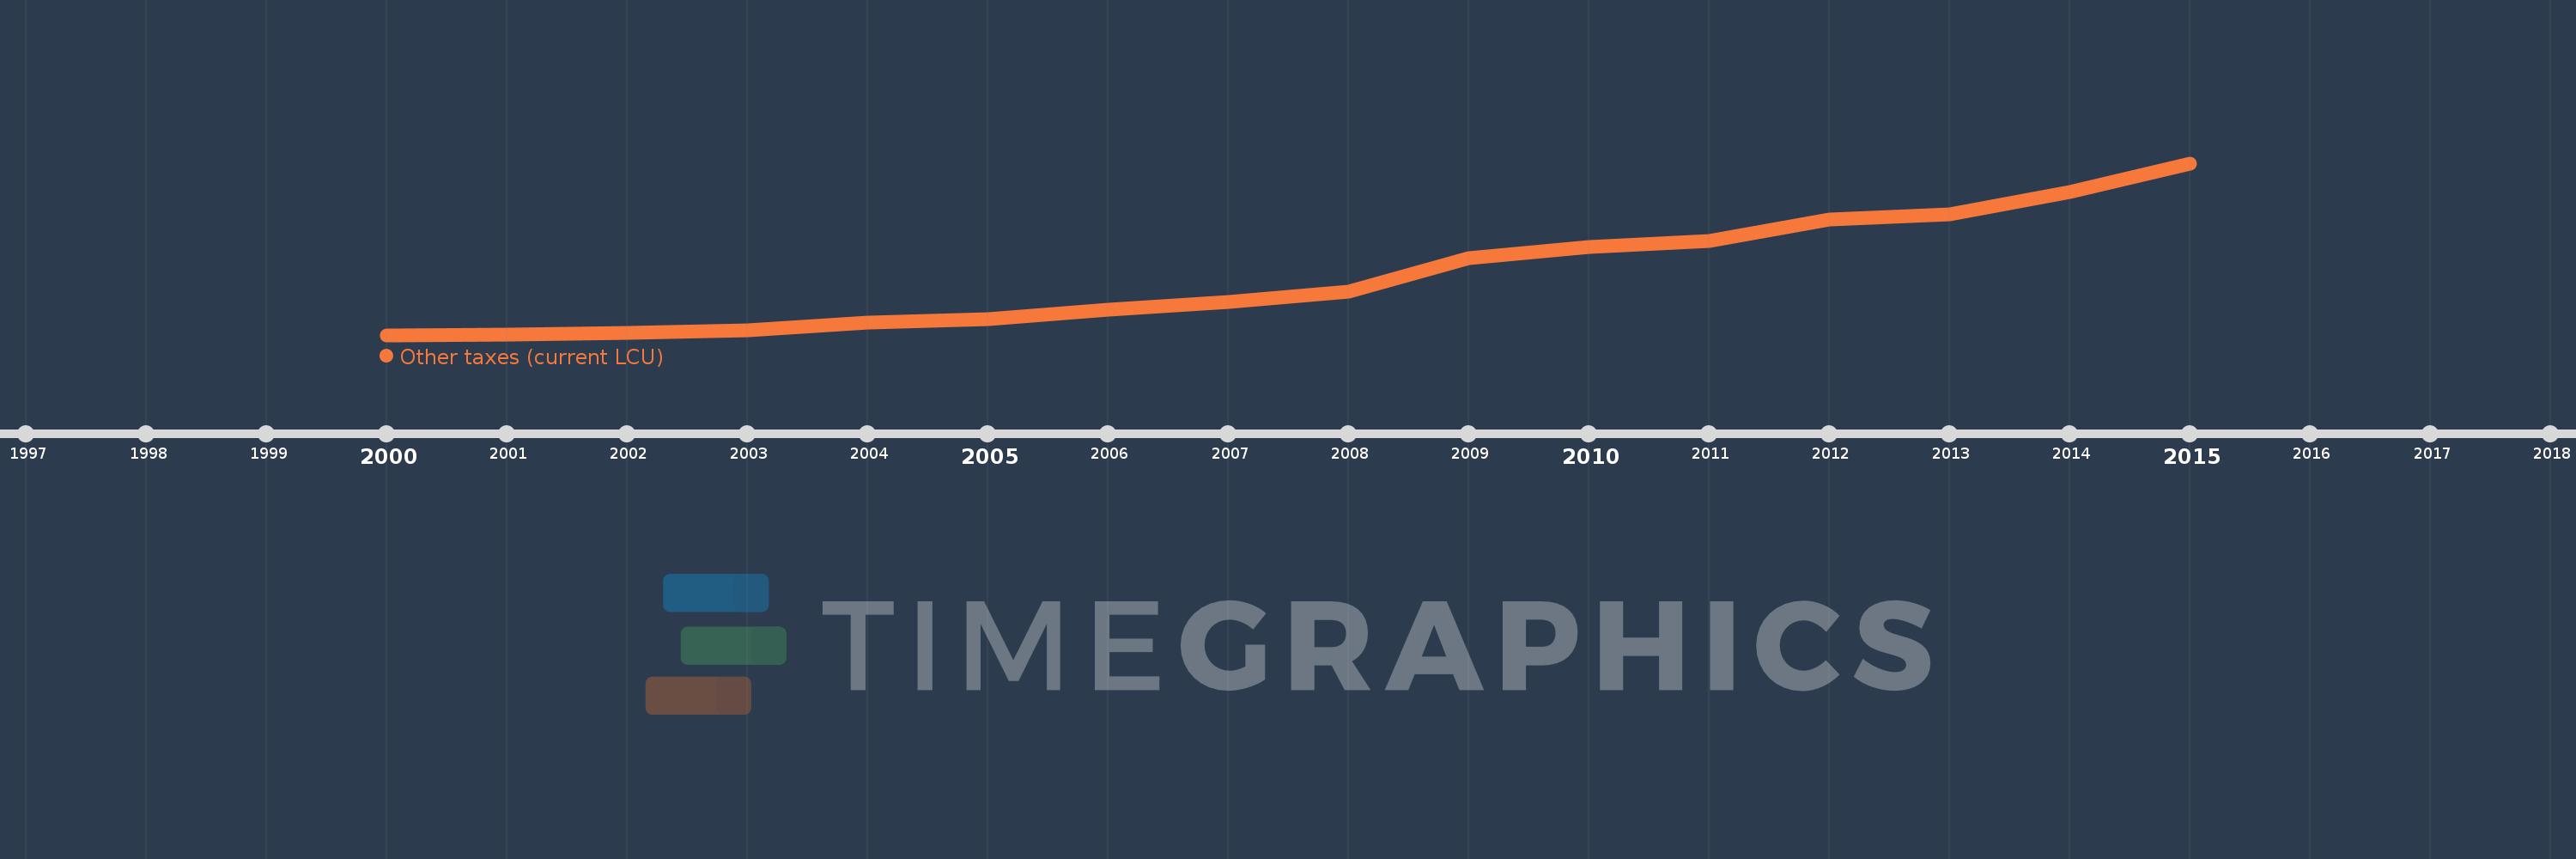
Other taxes (current LCU)
2015,2014,2013,2012,2011,2010,2009,2008,2007,2006,2005,2004,2003,2002,2001,2000
This statistics in other country:
AfghanistanAlbaniaAlgeriaAngolaAntigua and BarbudaArgentinaArmeniaAustraliaAustriaAzerbaijanBahamas, TheBahrainBangladeshBarbadosBelarusBelgiumBelizeBeninBhutanBoliviaBosnia and HerzegovinaBotswanaBrazilBulgariaBurkina FasoBurundiCabo VerdeCambodiaCentral African RepublicChileChinaColombiaCongo, Dem. Rep.Congo, Rep.Costa RicaCote d'IvoireCroatiaCyprusCzech RepublicDenmarkDominicaDominican RepublicEgypt, Arab Rep.El SalvadorEquatorial GuineaEstoniaEthiopiaFijiFinlandFranceGambia, TheGeorgiaGermanyGreeceGrenadaGuatemalaHondurasHong Kong SAR, ChinaHungaryIcelandIndiaIndonesiaIran, Islamic Rep.IraqIrelandIsraelItalyJamaicaJapanJordanKazakhstanKenyaKiribatiKorea, Rep.KuwaitKyrgyz RepublicLao PDRLatviaLebanonLesothoLiberiaLithuaniaLuxembourgMacao SAR, ChinaMacedonia, FYRMadagascarMalawiMalaysiaMaldivesMaliMaltaMauritiusMexicoMicronesia, Fed. Sts.MoldovaMongoliaMoroccoMozambiqueNamibiaNepalNetherlandsNew ZealandNicaraguaNorwayOmanPakistanPanamaPapua New GuineaParaguayPeruPhilippinesPolandPortugalRomaniaRussian FederationRwandaSamoaSan MarinoSao Tome and PrincipeSenegalSerbiaSeychellesSierra LeoneSingaporeSlovak RepublicSloveniaSolomon IslandsSouth AfricaSpainSri LankaSt. Kitts and NevisSt. LuciaSurinameSwazilandSwedenSwitzerlandSyrian Arab RepublicTajikistanTanzaniaThailandTimor-LesteTogoTrinidad and TobagoTunisiaTurkeyUgandaUkraineUnited KingdomUnited StatesUruguayVanuatuVenezuela, RBVietnamWest Bank and GazaYemen, Rep.ZambiaZimbabwe Timeline:
This timeline shows a graph from 2000 to 2015 of Angola. No data until 1999. Number of actual observations by date: 16.
Source name:
World Development Indicators
Source organization:
International Monetary Fund, Government Finance Statistics Yearbook and data files.
Categories, topics:
Public Sector
Last updated:
apr 23, 2017
Indicators value changes by year
Minimum:
109.109 mln
jan 1, 2000
Maximum:
172.463 bln
jan 1, 2015
At the date of observation
Value
Absolute change
Change from previous value
jan 1, 2000
109.109 mln
+109.109 mln
0.0%
jan 1, 2001
537.265 mln
+428.156 mln
392.41%
jan 1, 2002
2.103 bln
+1.566 bln
291.39%
jan 1, 2003
5.251 bln
+3.148 bln
149.72%
jan 1, 2004
12.411 bln
+7.16 bln
136.35%
jan 1, 2005
16.441 bln
+4.03 bln
32.47%
jan 1, 2006
25.941 bln
+9.5 bln
57.78%
jan 1, 2007
33.567 bln
+7.627 bln
29.4%
jan 1, 2008
43.381 bln
+9.814 bln
29.24%
jan 1, 2009
77.584 bln
+34.203 bln
78.84%
jan 1, 2010
88.672 bln
+11.089 bln
14.29%
jan 1, 2011
94.063 bln
+5.391 bln
6.08%
jan 1, 2012
115.785 bln
+21.723 bln
23.09%
jan 1, 2013
121.208 bln
+5.423 bln
4.68%
jan 1, 2014
143.77 bln
+22.561 bln
18.61%
jan 1, 2015
172.463 bln
+28.694 bln
19.96%
Ranking of countries by current statistics by years


Comments: