29
/
en
AIzaSyAYiBZKx7MnpbEhh9jyipgxe19OcubqV5w
April 1, 2024
84526
Benin
BEN
true
2
1
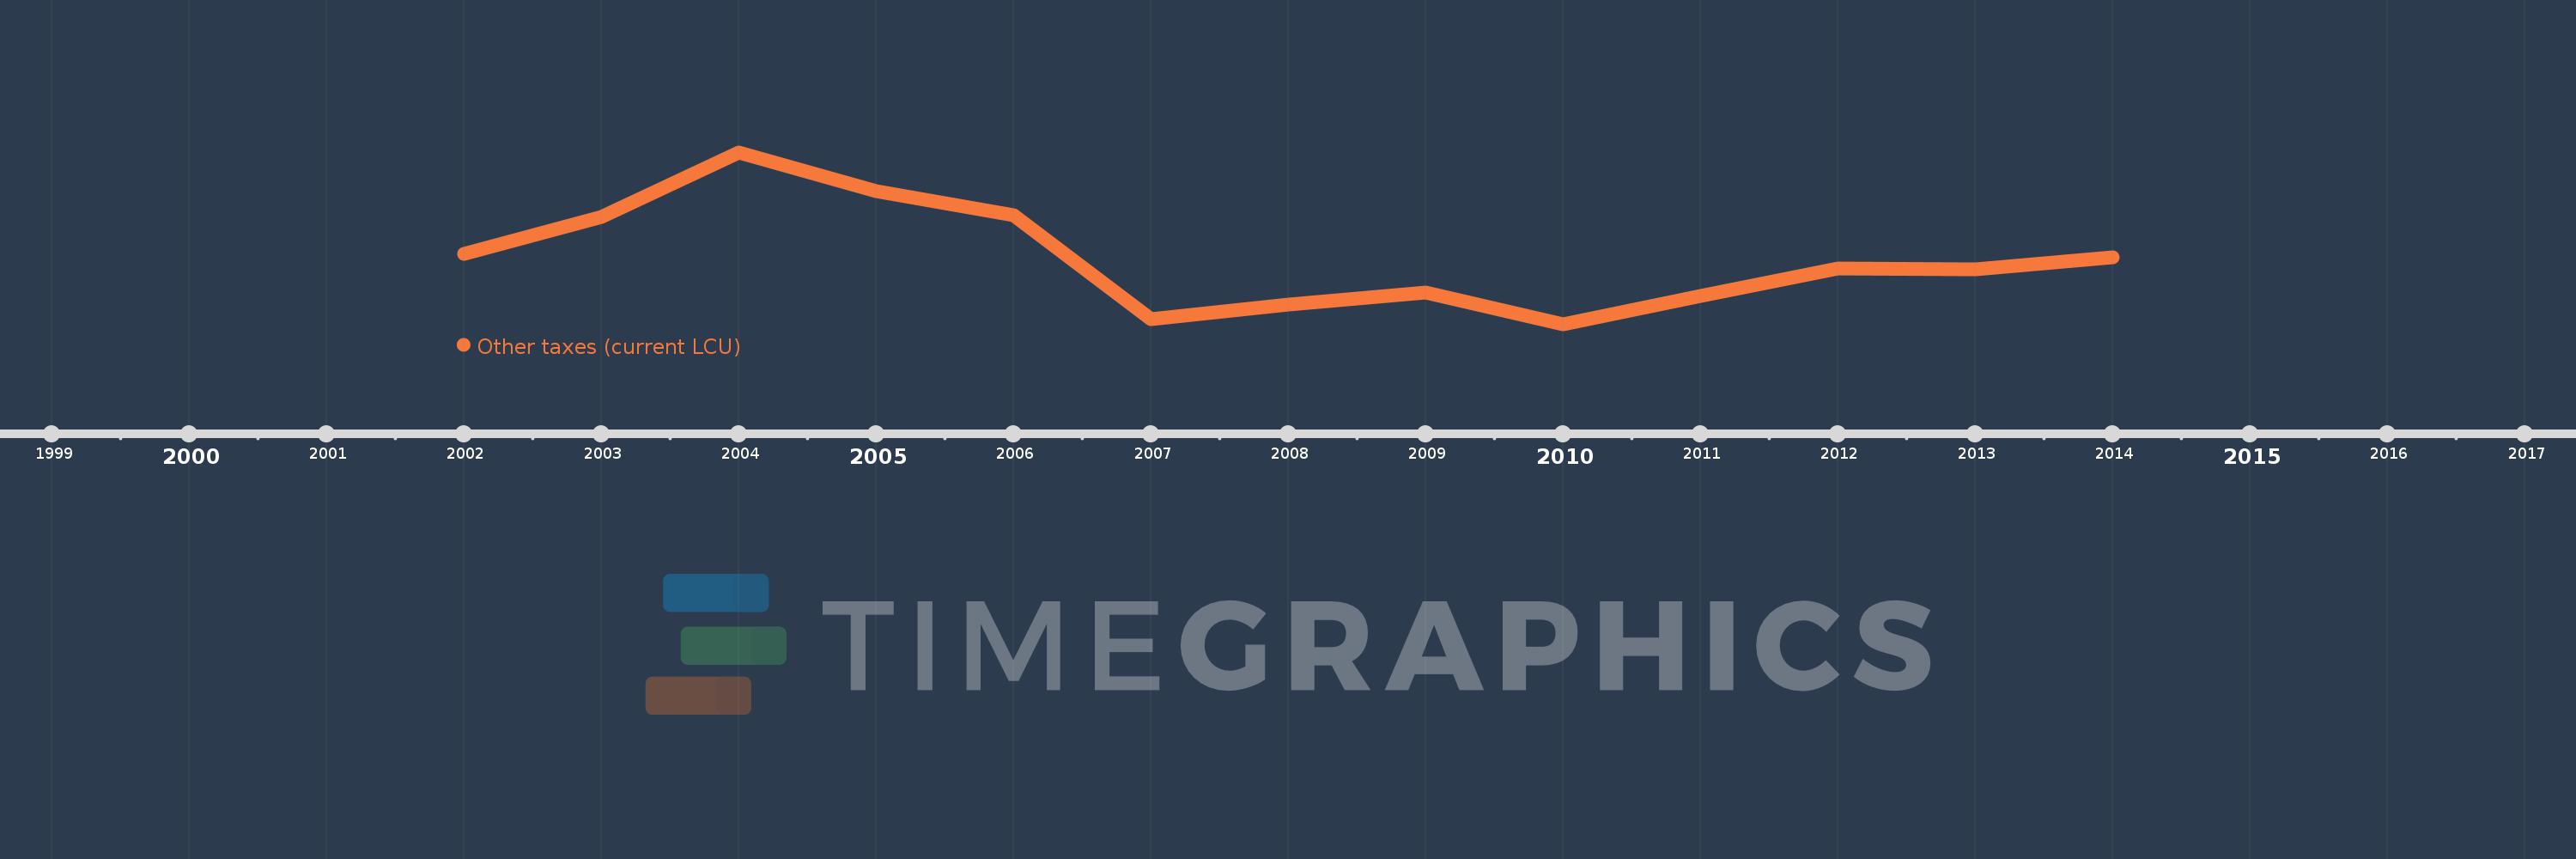
Other taxes (current LCU)
2014,2013,2012,2011,2010,2009,2008,2007,2006,2005,2004,2003,2002
This statistics in other country:
AfghanistanAlbaniaAlgeriaAngolaAntigua and BarbudaArgentinaArmeniaAustraliaAustriaAzerbaijanBahamas, TheBahrainBangladeshBarbadosBelarusBelgiumBelizeBeninBhutanBoliviaBosnia and HerzegovinaBotswanaBrazilBulgariaBurkina FasoBurundiCabo VerdeCambodiaCentral African RepublicChileChinaColombiaCongo, Dem. Rep.Congo, Rep.Costa RicaCote d'IvoireCroatiaCyprusCzech RepublicDenmarkDominicaDominican RepublicEgypt, Arab Rep.El SalvadorEquatorial GuineaEstoniaEthiopiaFijiFinlandFranceGambia, TheGeorgiaGermanyGreeceGrenadaGuatemalaHondurasHong Kong SAR, ChinaHungaryIcelandIndiaIndonesiaIran, Islamic Rep.IraqIrelandIsraelItalyJamaicaJapanJordanKazakhstanKenyaKiribatiKorea, Rep.KuwaitKyrgyz RepublicLao PDRLatviaLebanonLesothoLiberiaLithuaniaLuxembourgMacao SAR, ChinaMacedonia, FYRMadagascarMalawiMalaysiaMaldivesMaliMaltaMauritiusMexicoMicronesia, Fed. Sts.MoldovaMongoliaMoroccoMozambiqueNamibiaNepalNetherlandsNew ZealandNicaraguaNorwayOmanPakistanPanamaPapua New GuineaParaguayPeruPhilippinesPolandPortugalRomaniaRussian FederationRwandaSamoaSan MarinoSao Tome and PrincipeSenegalSerbiaSeychellesSierra LeoneSingaporeSlovak RepublicSloveniaSolomon IslandsSouth AfricaSpainSri LankaSt. Kitts and NevisSt. LuciaSurinameSwazilandSwedenSwitzerlandSyrian Arab RepublicTajikistanTanzaniaThailandTimor-LesteTogoTrinidad and TobagoTunisiaTurkeyUgandaUkraineUnited KingdomUnited StatesUruguayVanuatuVenezuela, RBVietnamWest Bank and GazaYemen, Rep.ZambiaZimbabwe Timeline:
This timeline shows a graph from 2002 to 2014 of Benin. No data until 2001. Number of actual observations by date: 13.
Source name:
World Development Indicators
Source organization:
International Monetary Fund, Government Finance Statistics Yearbook and data files.
Categories, topics:
Public Sector
Last updated:
apr 23, 2017
Indicators value changes by year
Minimum:
10.04 bln
jan 1, 2010
Maximum:
29.082 bln
jan 1, 2004
At the date of observation
Value
Absolute change
Change from previous value
jan 1, 2002
17.877 bln
+17.877 bln
0.0%
jan 1, 2003
21.972 bln
+4.094 bln
22.9%
jan 1, 2004
29.082 bln
+7.111 bln
32.36%
jan 1, 2005
24.811 bln
-4.271 bln
-14.69%
jan 1, 2006
22.092 bln
-2.718 bln
-10.96%
jan 1, 2007
10.567 bln
-11.526 bln
-52.17%
jan 1, 2008
12.18 bln
+1.613 bln
15.26%
jan 1, 2009
13.569 bln
+1.389 bln
11.4%
jan 1, 2010
10.04 bln
-3.529 bln
-26.01%
jan 1, 2011
13.195 bln
+3.155 bln
31.42%
jan 1, 2012
16.206 bln
+3.011 bln
22.82%
jan 1, 2013
16.105 bln
-101.595 mln
-0.63%
jan 1, 2014
17.5 bln
+1.395 bln
8.66%
Ranking of countries by current statistics by years


Comments: