29
/
en
AIzaSyAYiBZKx7MnpbEhh9jyipgxe19OcubqV5w
April 1, 2024
111372
Congo, Rep.
COG
true
2
1
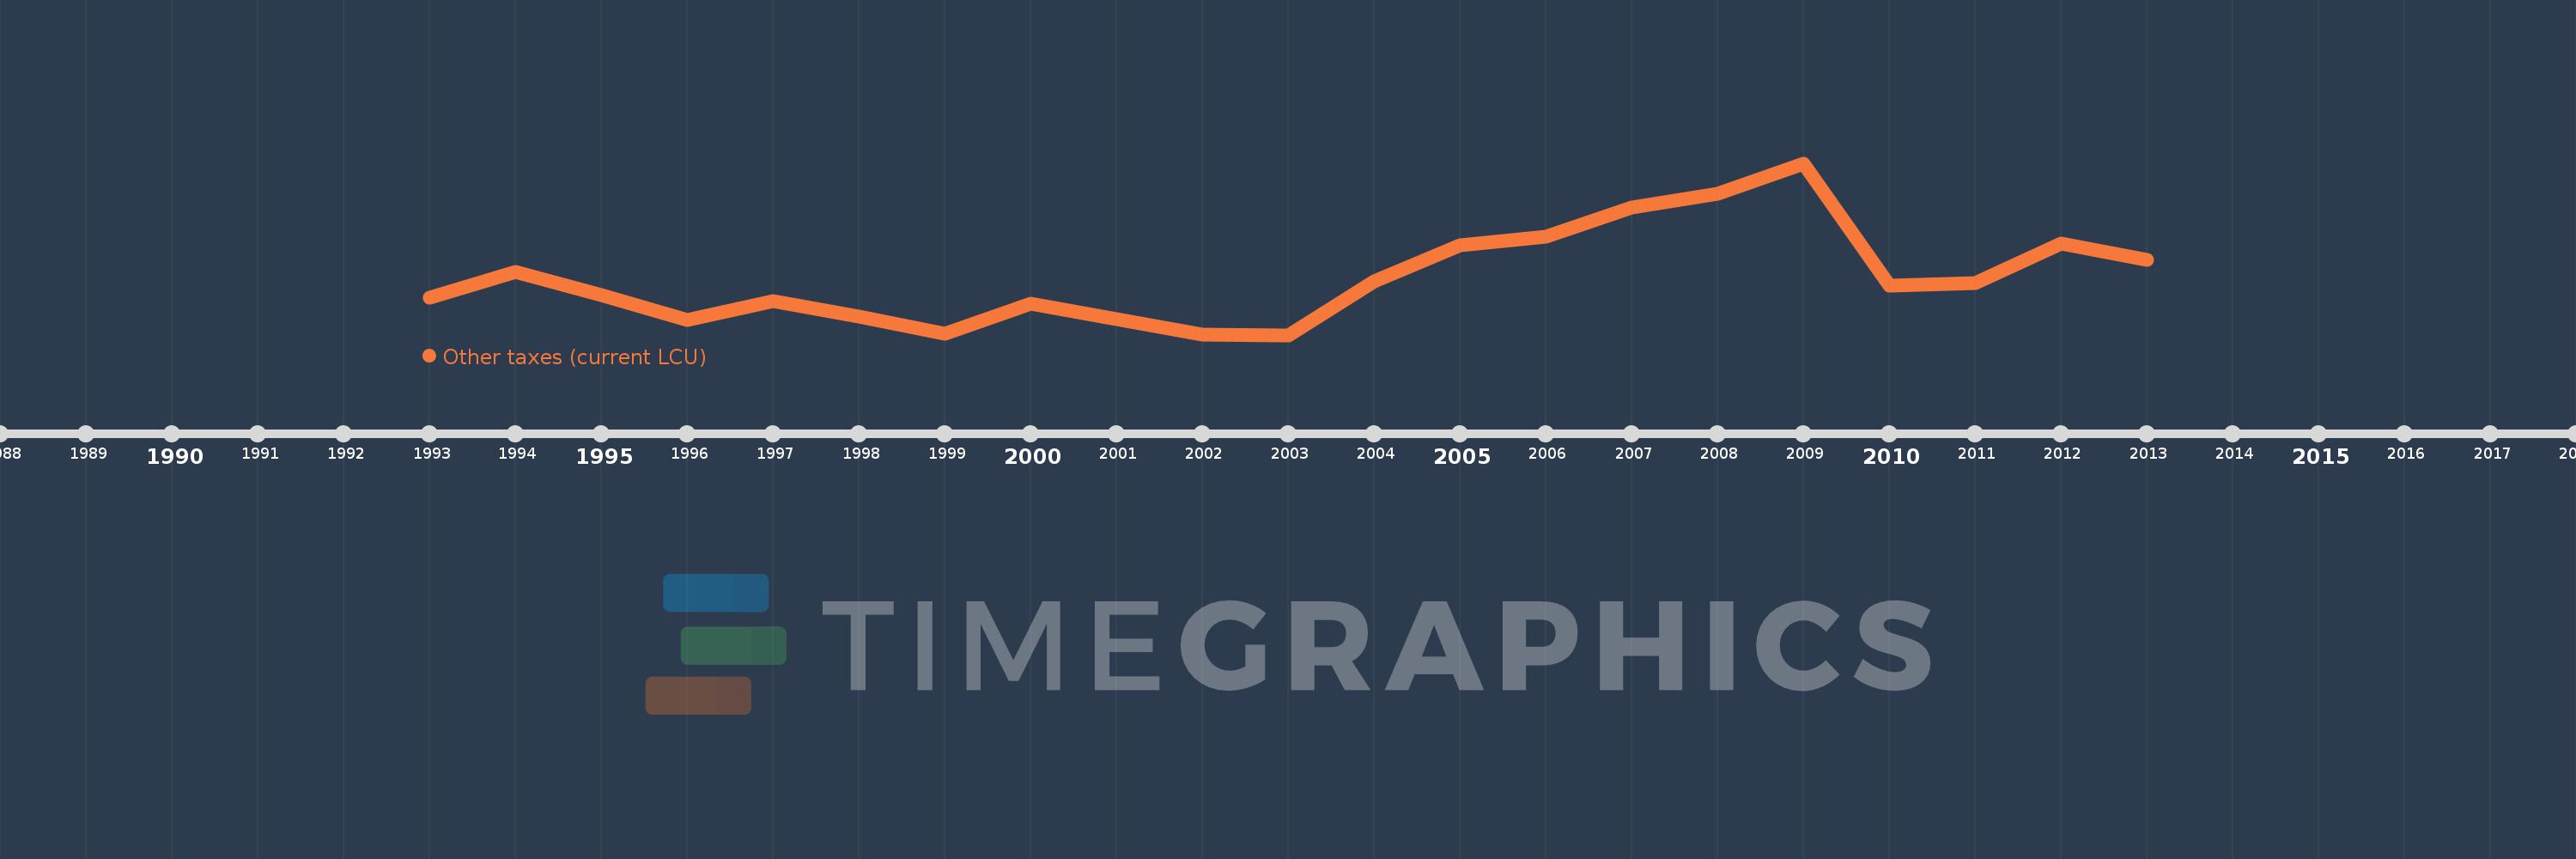
Other taxes (current LCU)
2013,2012,2011,2010,2009,2008,2007,2006,2005,2004,2003,2002,2000,1999,1998,1997,1996,1995,1994,1993
This statistics in other country:
AfghanistanAlbaniaAlgeriaAngolaAntigua and BarbudaArgentinaArmeniaAustraliaAustriaAzerbaijanBahamas, TheBahrainBangladeshBarbadosBelarusBelgiumBelizeBeninBhutanBoliviaBosnia and HerzegovinaBotswanaBrazilBulgariaBurkina FasoBurundiCabo VerdeCambodiaCentral African RepublicChileChinaColombiaCongo, Dem. Rep.Congo, Rep.Costa RicaCote d'IvoireCroatiaCyprusCzech RepublicDenmarkDominicaDominican RepublicEgypt, Arab Rep.El SalvadorEquatorial GuineaEstoniaEthiopiaFijiFinlandFranceGambia, TheGeorgiaGermanyGreeceGrenadaGuatemalaHondurasHong Kong SAR, ChinaHungaryIcelandIndiaIndonesiaIran, Islamic Rep.IraqIrelandIsraelItalyJamaicaJapanJordanKazakhstanKenyaKiribatiKorea, Rep.KuwaitKyrgyz RepublicLao PDRLatviaLebanonLesothoLiberiaLithuaniaLuxembourgMacao SAR, ChinaMacedonia, FYRMadagascarMalawiMalaysiaMaldivesMaliMaltaMauritiusMexicoMicronesia, Fed. Sts.MoldovaMongoliaMoroccoMozambiqueNamibiaNepalNetherlandsNew ZealandNicaraguaNorwayOmanPakistanPanamaPapua New GuineaParaguayPeruPhilippinesPolandPortugalRomaniaRussian FederationRwandaSamoaSan MarinoSao Tome and PrincipeSenegalSerbiaSeychellesSierra LeoneSingaporeSlovak RepublicSloveniaSolomon IslandsSouth AfricaSpainSri LankaSt. Kitts and NevisSt. LuciaSurinameSwazilandSwedenSwitzerlandSyrian Arab RepublicTajikistanTanzaniaThailandTimor-LesteTogoTrinidad and TobagoTunisiaTurkeyUgandaUkraineUnited KingdomUnited StatesUruguayVanuatuVenezuela, RBVietnamWest Bank and GazaYemen, Rep.ZambiaZimbabwe Timeline:
This timeline shows a graph from 1993 to 2013 of Congo, Rep.. No data until 1992. Number of actual observations by date: 20.
Source name:
World Development Indicators
Source organization:
International Monetary Fund, Government Finance Statistics Yearbook and data files.
Categories, topics:
Public Sector
Last updated:
apr 23, 2017
Indicators value changes by year
Minimum:
311.836 mln
jan 1, 2003
Maximum:
14.065 bln
jan 1, 2009
At the date of observation
Value
Absolute change
Change from previous value
jan 1, 1993
3.3 bln
+3.3 bln
0.0%
jan 1, 1994
5.4 bln
+2.1 bln
63.64%
jan 1, 1995
3.5 bln
-1.9 bln
-35.19%
jan 1, 1996
1.5 bln
-2.0 bln
-57.14%
jan 1, 1997
3.0 bln
+1.5 bln
100.0%
jan 1, 1998
1.8 bln
-1.2 bln
-40.0%
jan 1, 1999
400.0 mln
-1.4 bln
-77.78%
jan 1, 2000
2.8 bln
+2.4 bln
600.0%
jan 1, 2002
361.28 mln
-2.439 bln
-87.1%
jan 1, 2003
311.836 mln
-49.444 mln
-13.69%
jan 1, 2004
4.615 bln
+4.303 bln
1.38K%
jan 1, 2005
7.477 bln
+2.862 bln
62.02%
jan 1, 2006
8.155 bln
+678.618 mln
9.08%
jan 1, 2007
10.5 bln
+2.345 bln
28.75%
jan 1, 2008
11.625 bln
+1.125 bln
10.71%
jan 1, 2009
14.065 bln
+2.44 bln
20.99%
jan 1, 2010
4.241 bln
-9.824 bln
-69.85%
jan 1, 2011
4.483 bln
+242.55 mln
5.72%
jan 1, 2012
7.613 bln
+3.13 bln
69.81%
jan 1, 2013
6.33 bln
-1.284 bln
-16.86%
Ranking of countries by current statistics by years


Comments: