29
/
en
AIzaSyAYiBZKx7MnpbEhh9jyipgxe19OcubqV5w
April 1, 2024
70252
Argentina
ARG
true
2
1
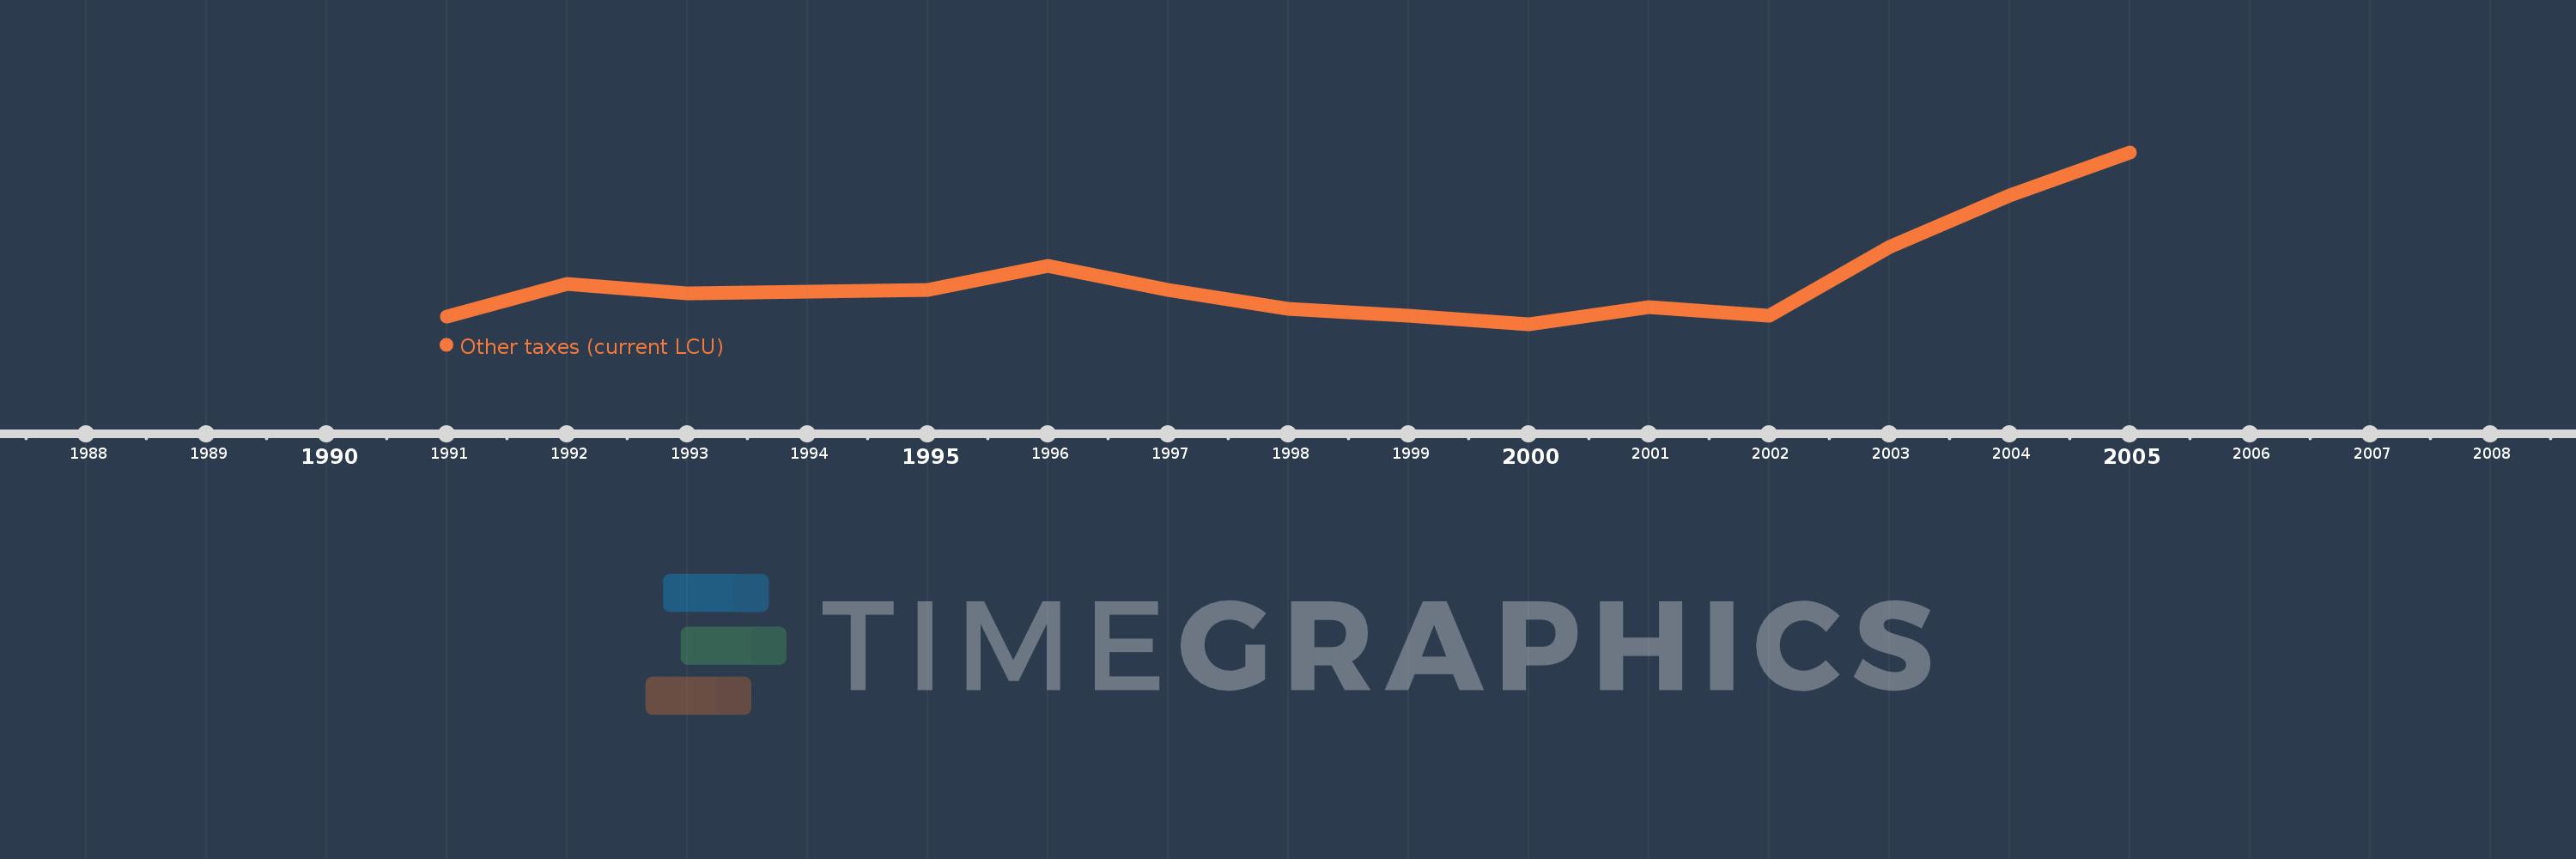
Other taxes (current LCU)
2005,2004,2003,2002,2001,2000,1999,1998,1997,1996,1995,1994,1993,1992,1991
This statistics in other country:
AfghanistanAlbaniaAlgeriaAngolaAntigua and BarbudaArgentinaArmeniaAustraliaAustriaAzerbaijanBahamas, TheBahrainBangladeshBarbadosBelarusBelgiumBelizeBeninBhutanBoliviaBosnia and HerzegovinaBotswanaBrazilBulgariaBurkina FasoBurundiCabo VerdeCambodiaCentral African RepublicChileChinaColombiaCongo, Dem. Rep.Congo, Rep.Costa RicaCote d'IvoireCroatiaCyprusCzech RepublicDenmarkDominicaDominican RepublicEgypt, Arab Rep.El SalvadorEquatorial GuineaEstoniaEthiopiaFijiFinlandFranceGambia, TheGeorgiaGermanyGreeceGrenadaGuatemalaHondurasHong Kong SAR, ChinaHungaryIcelandIndiaIndonesiaIran, Islamic Rep.IraqIrelandIsraelItalyJamaicaJapanJordanKazakhstanKenyaKiribatiKorea, Rep.KuwaitKyrgyz RepublicLao PDRLatviaLebanonLesothoLiberiaLithuaniaLuxembourgMacao SAR, ChinaMacedonia, FYRMadagascarMalawiMalaysiaMaldivesMaliMaltaMauritiusMexicoMicronesia, Fed. Sts.MoldovaMongoliaMoroccoMozambiqueNamibiaNepalNetherlandsNew ZealandNicaraguaNorwayOmanPakistanPanamaPapua New GuineaParaguayPeruPhilippinesPolandPortugalRomaniaRussian FederationRwandaSamoaSan MarinoSao Tome and PrincipeSenegalSerbiaSeychellesSierra LeoneSingaporeSlovak RepublicSloveniaSolomon IslandsSouth AfricaSpainSri LankaSt. Kitts and NevisSt. LuciaSurinameSwazilandSwedenSwitzerlandSyrian Arab RepublicTajikistanTanzaniaThailandTimor-LesteTogoTrinidad and TobagoTunisiaTurkeyUgandaUkraineUnited KingdomUnited StatesUruguayVanuatuVenezuela, RBVietnamWest Bank and GazaYemen, Rep.ZambiaZimbabwe Timeline:
This timeline shows a graph from 1991 to 2005 of Argentina. No data until 1990. Number of actual observations by date: 15.
Source name:
World Development Indicators
Source organization:
International Monetary Fund, Government Finance Statistics Yearbook and data files.
Categories, topics:
Public Sector
Last updated:
apr 23, 2017
Indicators value changes by year
Minimum:
358.9 mln
jan 1, 2000
Maximum:
5.043 bln
jan 1, 2005
At the date of observation
Value
Absolute change
Change from previous value
jan 1, 1991
573.3 mln
+573.3 mln
0.0%
jan 1, 1992
1.459 bln
+886.1 mln
154.56%
jan 1, 1993
1.211 bln
-248.6 mln
-17.03%
jan 1, 1994
1.238 bln
+27.4 mln
2.26%
jan 1, 1995
1.284 bln
+45.9 mln
3.71%
jan 1, 1996
1.958 bln
+673.7 mln
52.46%
jan 1, 1997
1.292 bln
-665.7 mln
-34.0%
jan 1, 1998
780.9 mln
-511.2 mln
-39.56%
jan 1, 1999
584.6 mln
-196.3 mln
-25.14%
jan 1, 2000
358.9 mln
-225.7 mln
-38.61%
jan 1, 2001
835.6 mln
+476.7 mln
132.82%
jan 1, 2002
590.4 mln
-245.2 mln
-29.34%
jan 1, 2003
2.467 bln
+1.877 bln
317.84%
jan 1, 2004
3.862 bln
+1.395 bln
56.55%
jan 1, 2005
5.043 bln
+1.181 bln
30.58%
Ranking of countries by current statistics by years


Comments: