30
/
AIzaSyAYiBZKx7MnpbEhh9jyipgxe19OcubqV5w
April 1, 2024
79821
Barbados
BRB
true
2
1
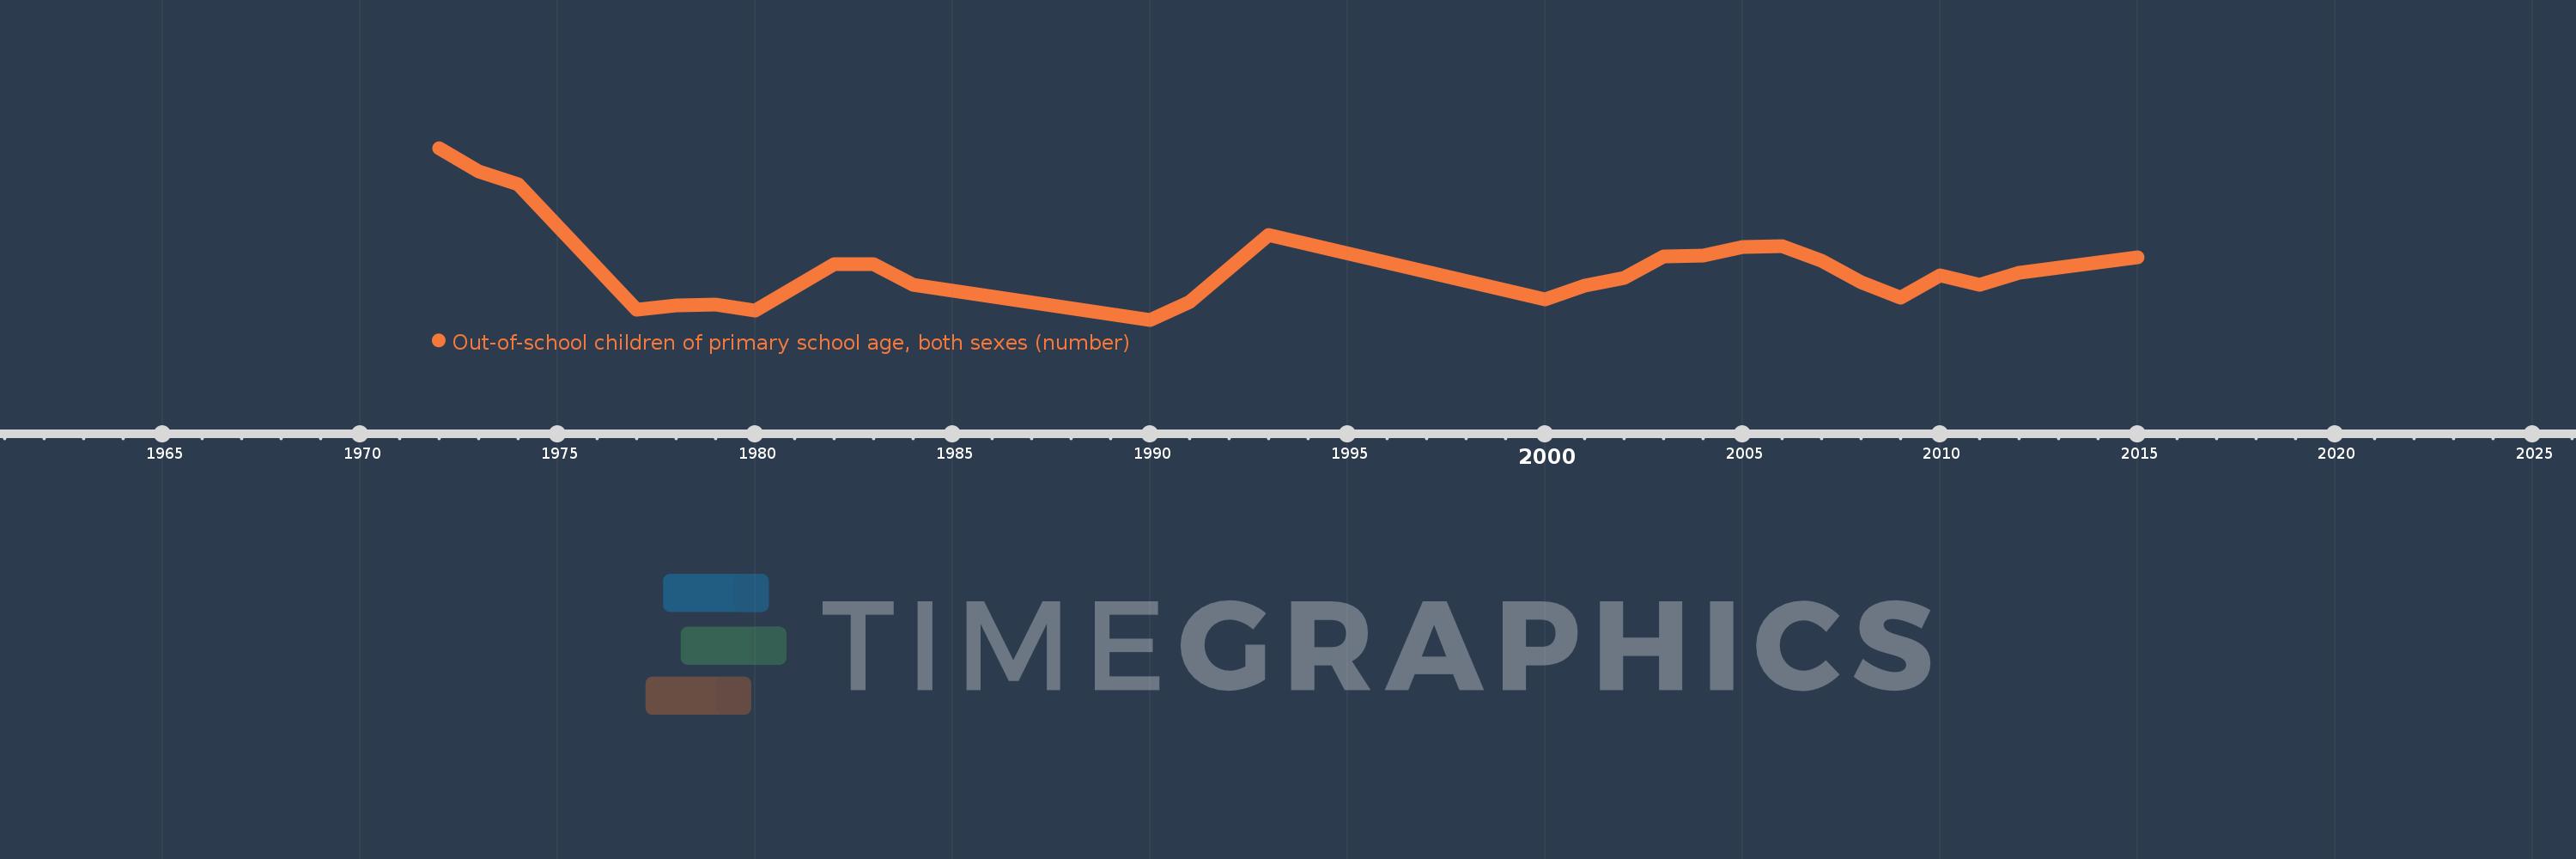
Out-of-school children of primary school age, both sexes (number)
2015,2012,2011,2010,2009,2008,2007,2006,2005,2004,2003,2002,2001,2000,1993,1991,1990,1984,1983,1982,1980,1979,1978,1977,1974,1973,1972
