30
/
AIzaSyAYiBZKx7MnpbEhh9jyipgxe19OcubqV5w
April 1, 2024
157731
Iran, Islamic Rep.
IRN
true
2
1
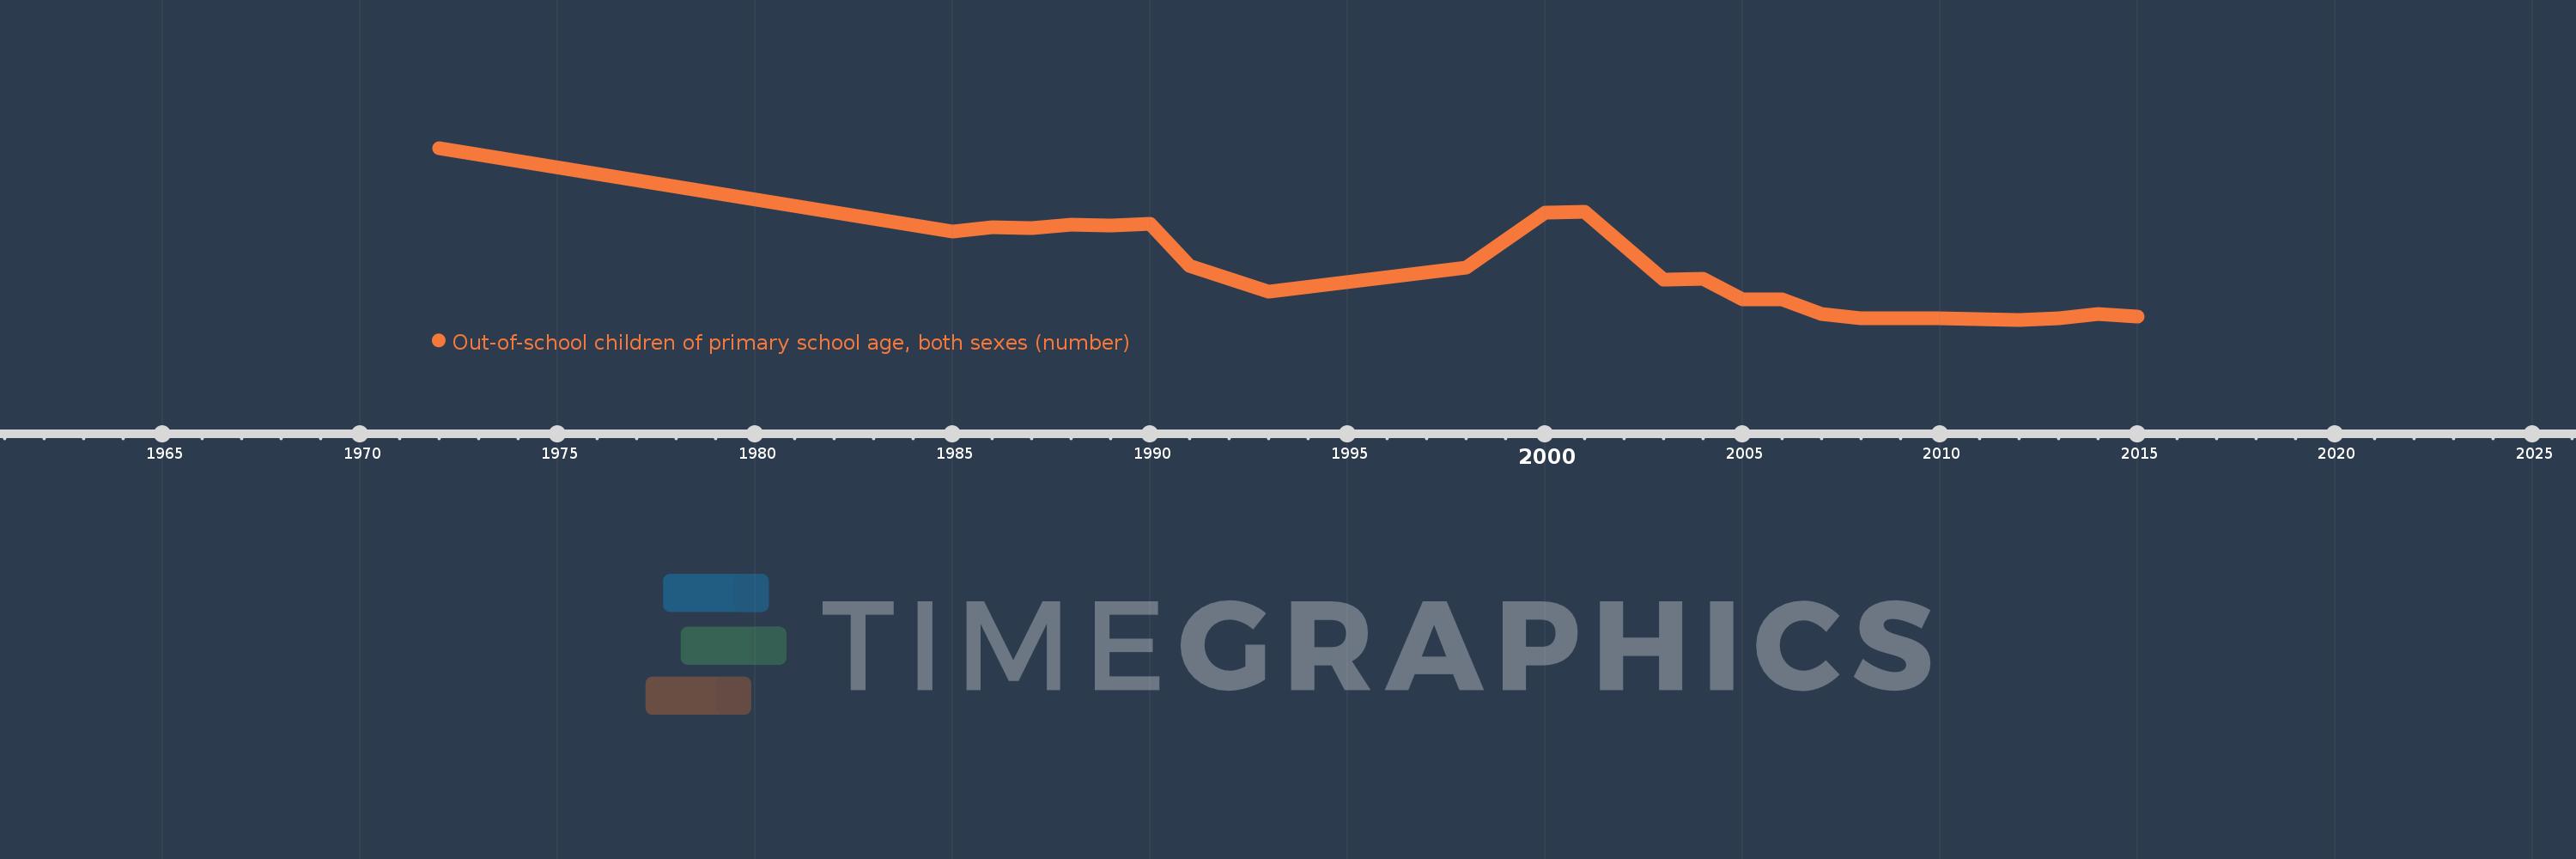
Out-of-school children of primary school age, both sexes (number)
2015,2014,2013,2012,2011,2010,2008,2007,2006,2005,2004,2003,2001,2000,1998,1993,1991,1990,1989,1988,1987,1986,1985,1972
