29
/
en
AIzaSyAYiBZKx7MnpbEhh9jyipgxe19OcubqV5w
April 1, 2024
28480
East Asia & Pacific (excluding high income)
EAP
false
2
1
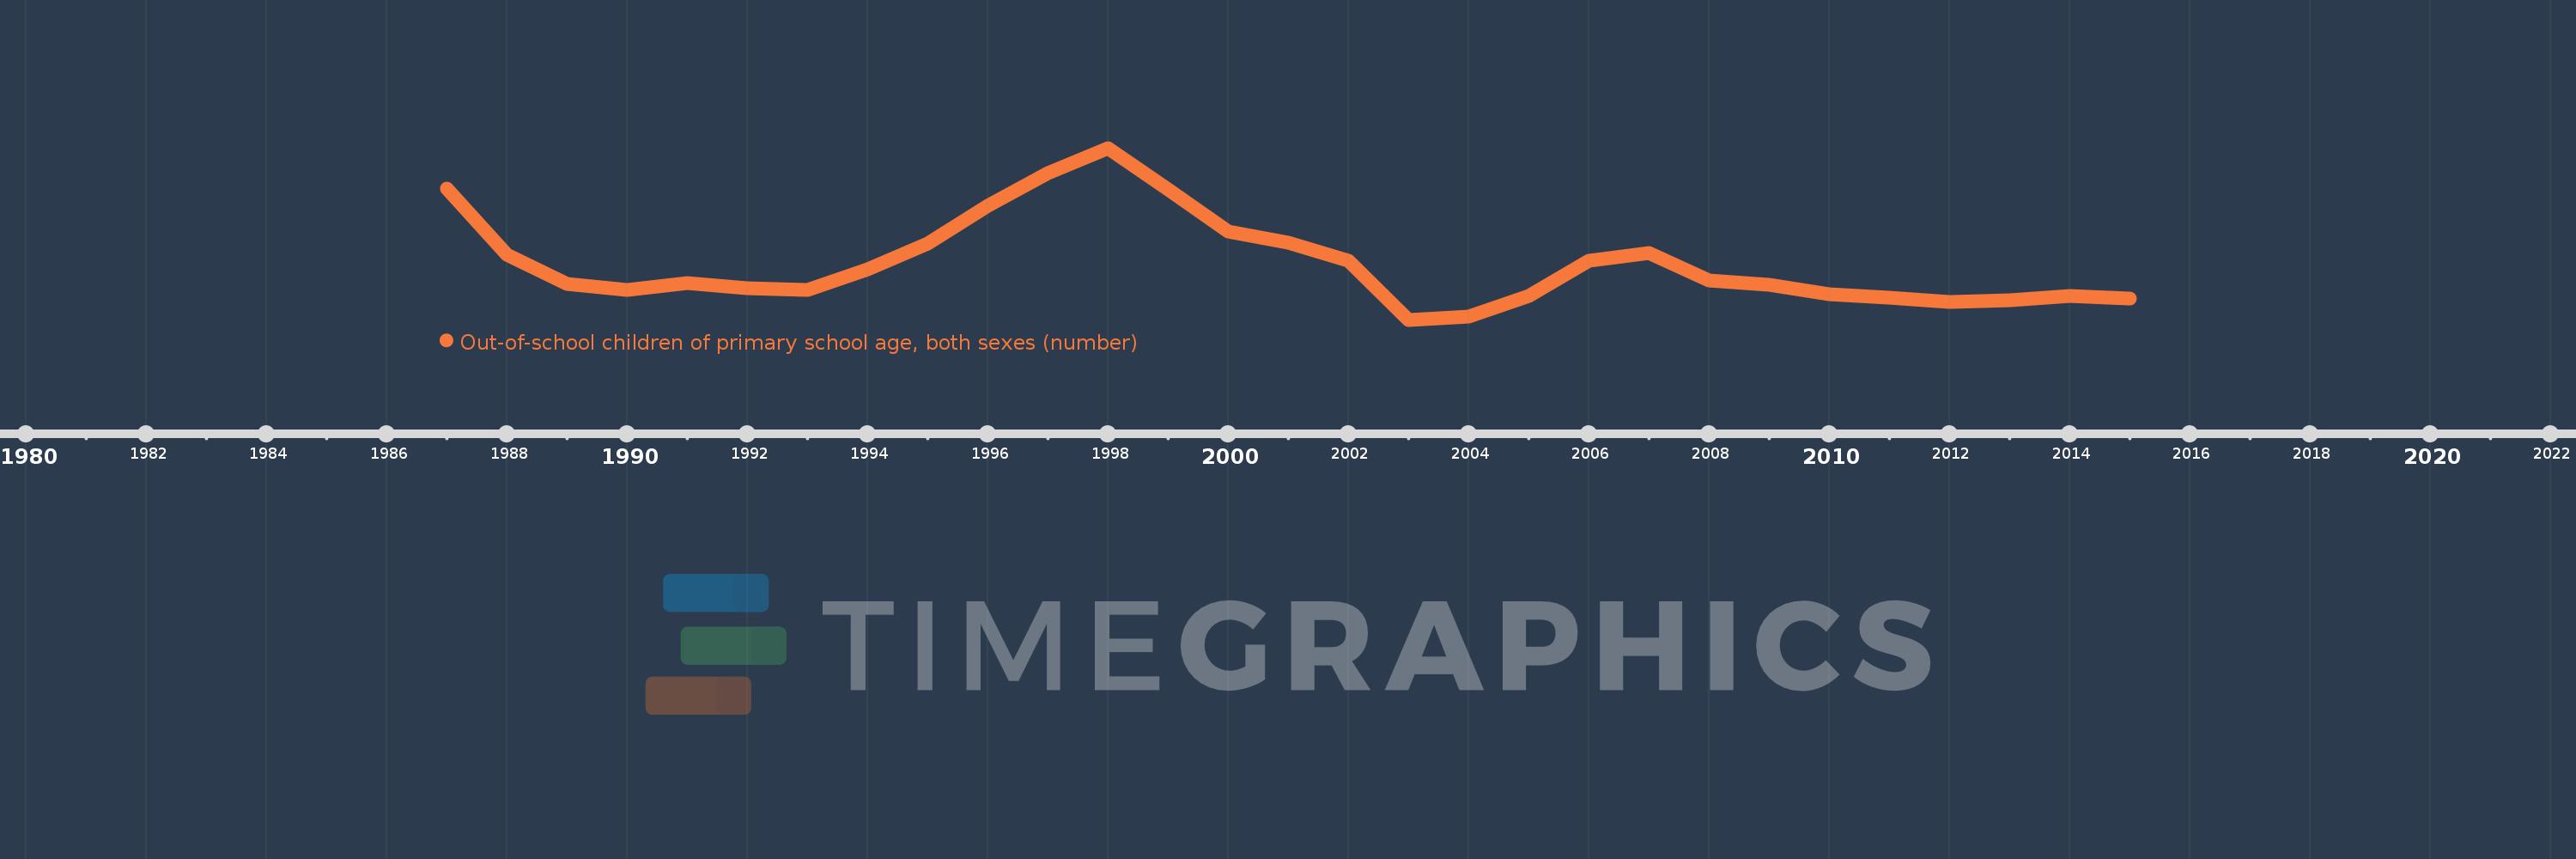
Out-of-school children of primary school age, both sexes (number)
2015,2014,2013,2012,2011,2010,2009,2008,2007,2006,2005,2004,2003,2002,2001,2000,1999,1998,1997,1996,1995,1994,1993,1992,1991,1990,1989,1988,1987
This statistics in other country:
AfghanistanAlbaniaAlgeriaAngolaAntigua and BarbudaArab WorldArgentinaArmeniaArubaAustraliaAustriaAzerbaijanBahamas, TheBahrainBangladeshBarbadosBelarusBelgiumBelizeBeninBermudaBhutanBoliviaBosnia and HerzegovinaBotswanaBrazilBrunei DarussalamBulgariaBurkina FasoBurundiCabo VerdeCambodiaCameroonCanadaCaribbean small statesCentral African RepublicCentral Europe and the BalticsChadChileChinaColombiaComorosCongo, Dem. Rep.Congo, Rep.Costa RicaCote d'IvoireCroatiaCubaCyprusDenmarkDjiboutiDominicaDominican RepublicEarly-demographic dividendEast Asia & PacificEast Asia & Pacific (excluding high income)East Asia & Pacific (IDA & IBRD countries)EcuadorEgypt, Arab Rep.El SalvadorEquatorial GuineaEritreaEstoniaEthiopiaEuro areaEurope & Central AsiaEurope & Central Asia (excluding high income)Europe & Central Asia (IDA & IBRD countries)European UnionFijiFinlandFragile and conflict affected situationsFranceGabonGambia, TheGeorgiaGermanyGhanaGreeceGrenadaGuatemalaGuineaGuinea-BissauGuyanaHaitiHeavily indebted poor countries (HIPC)High incomeHondurasHong Kong SAR, ChinaHungaryIBRD onlyIcelandIDA & IBRD totalIDA blendIDA onlyIDA totalIndiaIndonesiaIran, Islamic Rep.IraqIrelandIsraelItalyJamaicaJapanJordanKazakhstanKenyaKiribatiKorea, Dem. People’s Rep.Korea, Rep.KuwaitKyrgyz RepublicLao PDRLate-demographic dividendLatin America & Caribbean Latin America & Caribbean (excluding high income)Latin America & the Caribbean (IDA & IBRD countries)LatviaLeast developed countries: UN classificationLebanonLesothoLiberiaLibyaLiechtensteinLithuaniaLow & middle incomeLow incomeLower middle incomeLuxembourgMacao SAR, ChinaMacedonia, FYRMadagascarMalawiMalaysiaMaldivesMaliMaltaMarshall IslandsMauritaniaMauritiusMexicoMicronesia, Fed. Sts.Middle East & North AfricaMiddle East & North Africa (excluding high income)Middle East & North Africa (IDA & IBRD countries)Middle incomeMoldovaMongoliaMontenegroMoroccoMozambiqueMyanmarNamibiaNauruNepalNetherlandsNew ZealandNicaraguaNigerNigeriaNorth AmericaNorwayOECD membersOmanOther small statesPacific island small statesPakistanPalauPanamaPapua New GuineaParaguayPeruPhilippinesPolandPortugalPost-demographic dividendPre-demographic dividendPuerto RicoQatarRomaniaRussian FederationRwandaSamoaSan MarinoSao Tome and PrincipeSaudi ArabiaSenegalSerbiaSeychellesSierra LeoneSloveniaSmall statesSolomon IslandsSomaliaSouth AfricaSouth AsiaSouth Asia (IDA & IBRD)South SudanSpainSri LankaSt. Kitts and NevisSt. LuciaSt. Vincent and the GrenadinesSub-Saharan Africa Sub-Saharan Africa (excluding high income)Sub-Saharan Africa (IDA & IBRD countries)SudanSurinameSwazilandSwedenSwitzerlandSyrian Arab RepublicTajikistanTanzaniaThailandTimor-LesteTogoTongaTrinidad and TobagoTunisiaTurkeyTuvaluUgandaUkraineUnited Arab EmiratesUnited KingdomUnited StatesUpper middle incomeUruguayUzbekistanVanuatuVenezuela, RBVietnamWest Bank and GazaWorldYemen, Rep.ZambiaZimbabwe Timeline:
This timeline shows a graph from 1987 to 2015 of East Asia & Pacific (excluding high income). No data until 1986. Number of actual observations by date: 29.
Source name:
World Development Indicators
Source organization:
UNESCO Institute for Statistics
Categories, topics:
Education
Last updated:
apr 23, 2017
Indicators value changes by year
Minimum:
4.724 mln
jan 1, 2003
Maximum:
17.468 mln
jan 1, 1998
At the date of observation
Value
Absolute change
Change from previous value
jan 1, 1987
14.432 mln
+14.432 mln
0.0%
jan 1, 1988
9.568 mln
-4.864 mln
-33.7%
jan 1, 1989
7.384 mln
-2.184 mln
-22.82%
jan 1, 1990
6.952 mln
-431.989K
-5.85%
jan 1, 1991
7.453 mln
+501.18K
7.21%
jan 1, 1992
7.081 mln
-372.494K
-5.0%
jan 1, 1993
6.964 mln
-116.827K
-1.65%
jan 1, 1994
8.445 mln
+1.481 mln
21.27%
jan 1, 1995
10.382 mln
+1.936 mln
22.93%
jan 1, 1996
13.207 mln
+2.825 mln
27.21%
jan 1, 1997
15.612 mln
+2.405 mln
18.21%
jan 1, 1998
17.468 mln
+1.855 mln
11.88%
jan 1, 1999
14.416 mln
-3.051 mln
-17.47%
jan 1, 2000
11.287 mln
-3.129 mln
-21.7%
jan 1, 2001
10.413 mln
-873.96K
-7.74%
jan 1, 2002
9.128 mln
-1.286 mln
-12.35%
jan 1, 2003
4.724 mln
-4.403 mln
-48.24%
jan 1, 2004
4.957 mln
+232.974K
4.93%
jan 1, 2005
6.5 mln
+1.543 mln
31.13%
jan 1, 2006
9.104 mln
+2.604 mln
40.06%
jan 1, 2007
9.683 mln
+578.747K
6.36%
jan 1, 2008
7.631 mln
-2.052 mln
-21.2%
jan 1, 2009
7.326 mln
-305.181K
-4.0%
jan 1, 2010
6.601 mln
-724.459K
-9.89%
jan 1, 2011
6.38 mln
-220.666K
-3.34%
jan 1, 2012
6.061 mln
-319.808K
-5.01%
jan 1, 2013
6.139 mln
+78.613K
1.3%
jan 1, 2014
6.479 mln
+340.046K
5.54%
jan 1, 2015
6.302 mln
-177.529K
-2.74%
Ranking of countries by current statistics by years


Comments: