29
/
en
AIzaSyAYiBZKx7MnpbEhh9jyipgxe19OcubqV5w
April 1, 2024
55049
Post-demographic dividend
PST
false
2
1
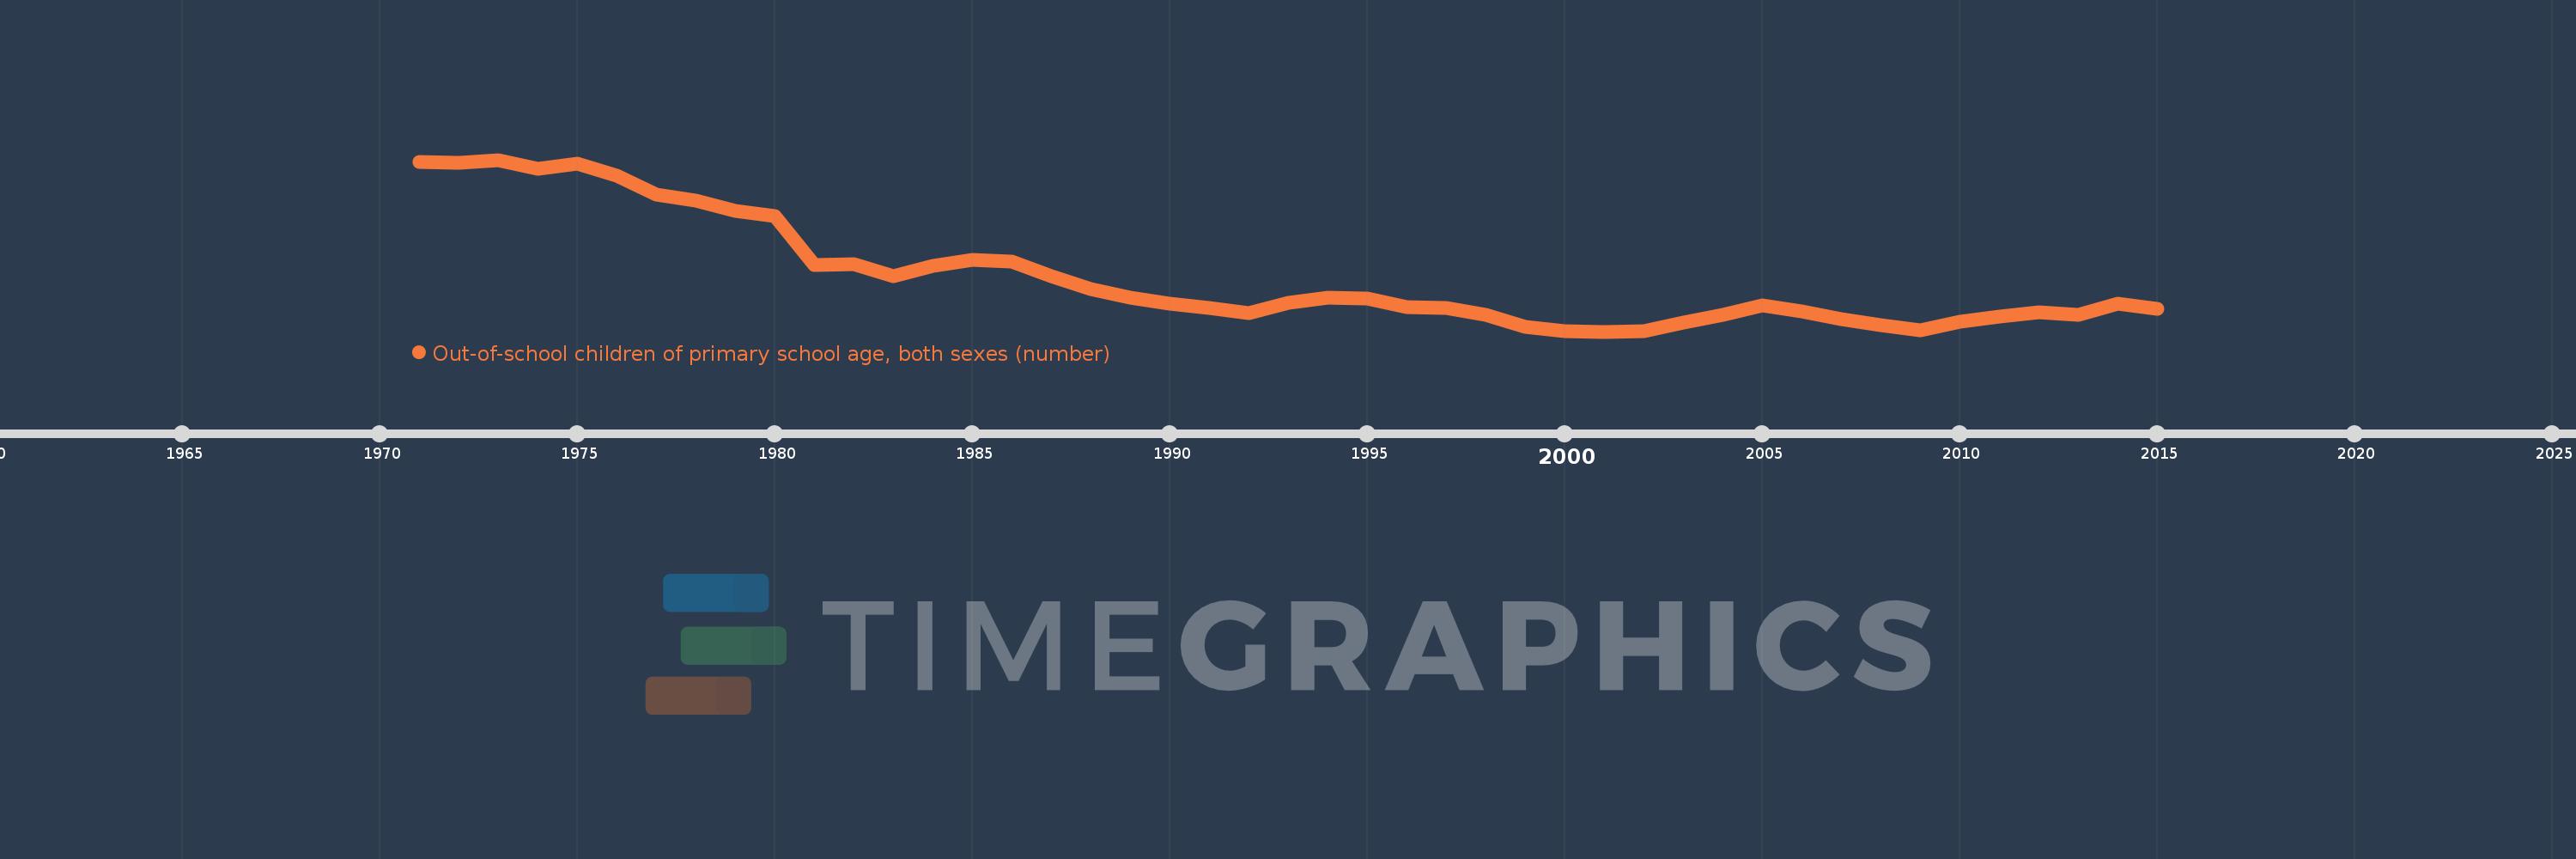
Out-of-school children of primary school age, both sexes (number)
2015,2014,2013,2012,2011,2010,2009,2008,2007,2006,2005,2004,2003,2002,2001,2000,1999,1998,1997,1996,1995,1994,1993,1992,1991,1990,1989,1988,1987,1986,1985,1984,1983,1982,1981,1980,1979,1978,1977,1976,1975,1974,1973,1972,1971
This statistics in other country:
AfghanistanAlbaniaAlgeriaAngolaAntigua and BarbudaArab WorldArgentinaArmeniaArubaAustraliaAustriaAzerbaijanBahamas, TheBahrainBangladeshBarbadosBelarusBelgiumBelizeBeninBermudaBhutanBoliviaBosnia and HerzegovinaBotswanaBrazilBrunei DarussalamBulgariaBurkina FasoBurundiCabo VerdeCambodiaCameroonCanadaCaribbean small statesCentral African RepublicCentral Europe and the BalticsChadChileChinaColombiaComorosCongo, Dem. Rep.Congo, Rep.Costa RicaCote d'IvoireCroatiaCubaCyprusDenmarkDjiboutiDominicaDominican RepublicEarly-demographic dividendEast Asia & PacificEast Asia & Pacific (excluding high income)East Asia & Pacific (IDA & IBRD countries)EcuadorEgypt, Arab Rep.El SalvadorEquatorial GuineaEritreaEstoniaEthiopiaEuro areaEurope & Central AsiaEurope & Central Asia (excluding high income)Europe & Central Asia (IDA & IBRD countries)European UnionFijiFinlandFragile and conflict affected situationsFranceGabonGambia, TheGeorgiaGermanyGhanaGreeceGrenadaGuatemalaGuineaGuinea-BissauGuyanaHaitiHeavily indebted poor countries (HIPC)High incomeHondurasHong Kong SAR, ChinaHungaryIBRD onlyIcelandIDA & IBRD totalIDA blendIDA onlyIDA totalIndiaIndonesiaIran, Islamic Rep.IraqIrelandIsraelItalyJamaicaJapanJordanKazakhstanKenyaKiribatiKorea, Dem. People’s Rep.Korea, Rep.KuwaitKyrgyz RepublicLao PDRLate-demographic dividendLatin America & Caribbean Latin America & Caribbean (excluding high income)Latin America & the Caribbean (IDA & IBRD countries)LatviaLeast developed countries: UN classificationLebanonLesothoLiberiaLibyaLiechtensteinLithuaniaLow & middle incomeLow incomeLower middle incomeLuxembourgMacao SAR, ChinaMacedonia, FYRMadagascarMalawiMalaysiaMaldivesMaliMaltaMarshall IslandsMauritaniaMauritiusMexicoMicronesia, Fed. Sts.Middle East & North AfricaMiddle East & North Africa (excluding high income)Middle East & North Africa (IDA & IBRD countries)Middle incomeMoldovaMongoliaMontenegroMoroccoMozambiqueMyanmarNamibiaNauruNepalNetherlandsNew ZealandNicaraguaNigerNigeriaNorth AmericaNorwayOECD membersOmanOther small statesPacific island small statesPakistanPalauPanamaPapua New GuineaParaguayPeruPhilippinesPolandPortugalPost-demographic dividendPre-demographic dividendPuerto RicoQatarRomaniaRussian FederationRwandaSamoaSan MarinoSao Tome and PrincipeSaudi ArabiaSenegalSerbiaSeychellesSierra LeoneSloveniaSmall statesSolomon IslandsSomaliaSouth AfricaSouth AsiaSouth Asia (IDA & IBRD)South SudanSpainSri LankaSt. Kitts and NevisSt. LuciaSt. Vincent and the GrenadinesSub-Saharan Africa Sub-Saharan Africa (excluding high income)Sub-Saharan Africa (IDA & IBRD countries)SudanSurinameSwazilandSwedenSwitzerlandSyrian Arab RepublicTajikistanTanzaniaThailandTimor-LesteTogoTongaTrinidad and TobagoTunisiaTurkeyTuvaluUgandaUkraineUnited Arab EmiratesUnited KingdomUnited StatesUpper middle incomeUruguayUzbekistanVanuatuVenezuela, RBVietnamWest Bank and GazaWorldYemen, Rep.ZambiaZimbabwe Timeline:
This timeline shows a graph from 1971 to 2015 of Post-demographic dividend. No data until 1970. Number of actual observations by date: 45.
Source name:
World Development Indicators
Source organization:
UNESCO Institute for Statistics
Categories, topics:
Education
Last updated:
apr 23, 2017
Indicators value changes by year
Minimum:
1.183 mln
jan 1, 2001
Maximum:
7.796 mln
jan 1, 1973
At the date of observation
Value
Absolute change
Change from previous value
jan 1, 1971
7.708 mln
+7.708 mln
0.0%
jan 1, 1972
7.686 mln
-21.941K
-0.28%
jan 1, 1973
7.796 mln
+110.355K
1.44%
jan 1, 1974
7.459 mln
-337.015K
-4.32%
jan 1, 1975
7.638 mln
+179.063K
2.4%
jan 1, 1976
7.196 mln
-441.991K
-5.79%
jan 1, 1977
6.466 mln
-730.542K
-10.15%
jan 1, 1978
6.217 mln
-248.444K
-3.84%
jan 1, 1979
5.823 mln
-394.024K
-6.34%
jan 1, 1980
5.62 mln
-203.438K
-3.49%
jan 1, 1981
3.745 mln
-1.875 mln
-33.37%
jan 1, 1982
3.774 mln
+29.124K
0.78%
jan 1, 1983
3.302 mln
-471.463K
-12.49%
jan 1, 1984
3.722 mln
+419.272K
12.7%
jan 1, 1985
3.942 mln
+220.136K
5.92%
jan 1, 1986
3.881 mln
-61.057K
-1.55%
jan 1, 1987
3.311 mln
-569.512K
-14.68%
jan 1, 1988
2.826 mln
-484.921K
-14.65%
jan 1, 1989
2.474 mln
-352.211K
-12.46%
jan 1, 1990
2.258 mln
-216.223K
-8.74%
jan 1, 1991
2.077 mln
-181.184K
-8.02%
jan 1, 1992
1.896 mln
-180.16K
-8.68%
jan 1, 1993
2.277 mln
+380.184K
20.05%
jan 1, 1994
2.48 mln
+203.719K
8.95%
jan 1, 1995
2.47 mln
-10.621K
-0.43%
jan 1, 1996
2.116 mln
-354.143K
-14.34%
jan 1, 1997
2.106 mln
-9.99K
-0.47%
jan 1, 1998
1.822 mln
-283.716K
-13.47%
jan 1, 1999
1.368 mln
-453.654K
-24.9%
jan 1, 2000
1.213 mln
-155.377K
-11.36%
jan 1, 2001
1.183 mln
-29.943K
-2.47%
jan 1, 2002
1.205 mln
+22.415K
1.89%
jan 1, 2003
1.515 mln
+309.411K
25.67%
jan 1, 2004
1.815 mln
+299.964K
19.8%
jan 1, 2005
2.183 mln
+368.414K
20.3%
jan 1, 2006
1.963 mln
-219.775K
-10.07%
jan 1, 2007
1.674 mln
-288.998K
-14.72%
jan 1, 2008
1.419 mln
-254.942K
-15.23%
jan 1, 2009
1.24 mln
-179.281K
-12.63%
jan 1, 2010
1.547 mln
+307.324K
24.78%
jan 1, 2011
1.756 mln
+208.976K
13.5%
jan 1, 2012
1.924 mln
+167.777K
9.55%
jan 1, 2013
1.844 mln
-80.49K
-4.18%
jan 1, 2014
2.255 mln
+410.893K
22.29%
jan 1, 2015
2.048 mln
-206.456K
-9.16%
Ranking of countries by current statistics by years


Comments: