29
/
en
AIzaSyAYiBZKx7MnpbEhh9jyipgxe19OcubqV5w
April 1, 2024
222651
Peru
PER
true
2
1
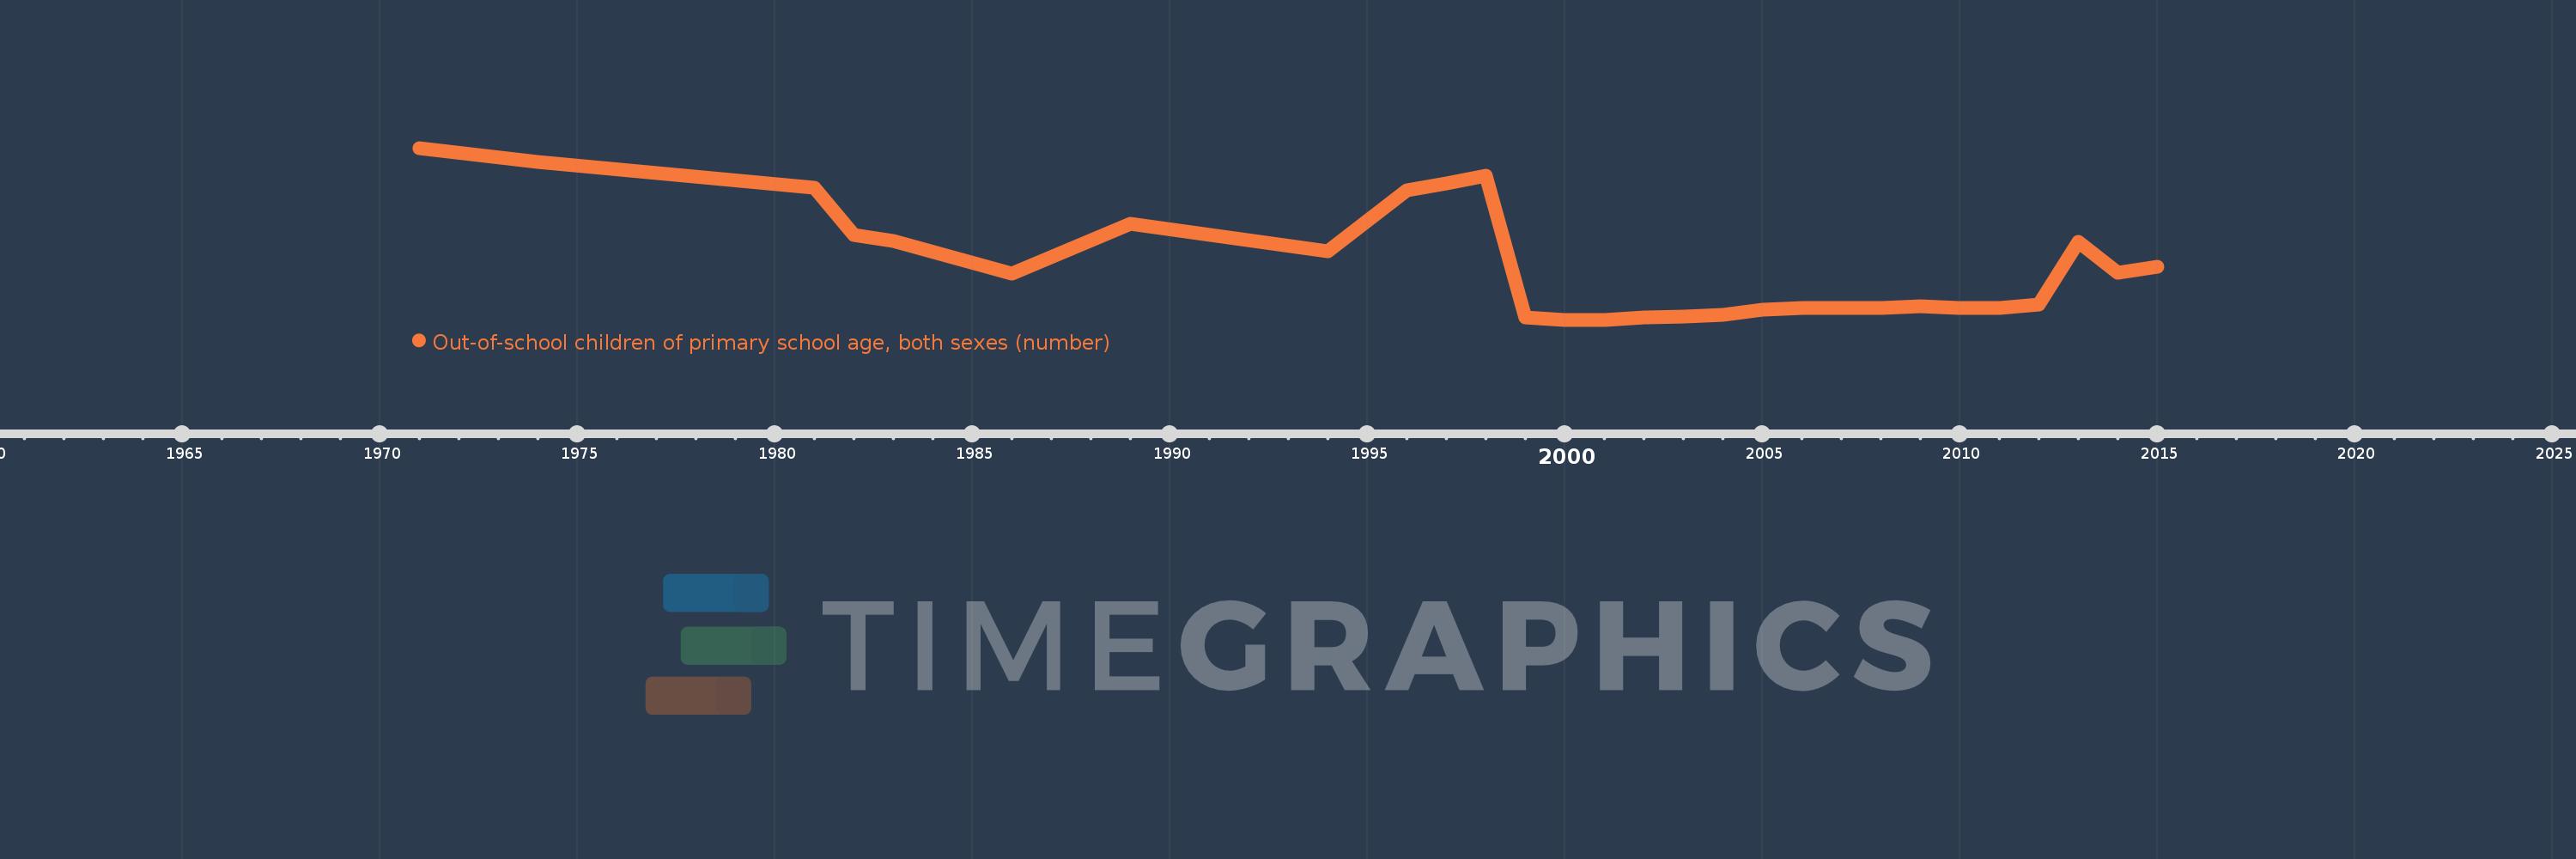
Out-of-school children of primary school age, both sexes (number)
2015,2014,2013,2012,2011,2010,2009,2008,2007,2006,2005,2004,2003,2002,2001,2000,1999,1998,1997,1996,1994,1989,1986,1983,1982,1981,1974,1971
This statistics in other country:
AfghanistanAlbaniaAlgeriaAngolaAntigua and BarbudaArab WorldArgentinaArmeniaArubaAustraliaAustriaAzerbaijanBahamas, TheBahrainBangladeshBarbadosBelarusBelgiumBelizeBeninBermudaBhutanBoliviaBosnia and HerzegovinaBotswanaBrazilBrunei DarussalamBulgariaBurkina FasoBurundiCabo VerdeCambodiaCameroonCanadaCaribbean small statesCentral African RepublicCentral Europe and the BalticsChadChileChinaColombiaComorosCongo, Dem. Rep.Congo, Rep.Costa RicaCote d'IvoireCroatiaCubaCyprusDenmarkDjiboutiDominicaDominican RepublicEarly-demographic dividendEast Asia & PacificEast Asia & Pacific (excluding high income)East Asia & Pacific (IDA & IBRD countries)EcuadorEgypt, Arab Rep.El SalvadorEquatorial GuineaEritreaEstoniaEthiopiaEuro areaEurope & Central AsiaEurope & Central Asia (excluding high income)Europe & Central Asia (IDA & IBRD countries)European UnionFijiFinlandFragile and conflict affected situationsFranceGabonGambia, TheGeorgiaGermanyGhanaGreeceGrenadaGuatemalaGuineaGuinea-BissauGuyanaHaitiHeavily indebted poor countries (HIPC)High incomeHondurasHong Kong SAR, ChinaHungaryIBRD onlyIcelandIDA & IBRD totalIDA blendIDA onlyIDA totalIndiaIndonesiaIran, Islamic Rep.IraqIrelandIsraelItalyJamaicaJapanJordanKazakhstanKenyaKiribatiKorea, Dem. People’s Rep.Korea, Rep.KuwaitKyrgyz RepublicLao PDRLate-demographic dividendLatin America & Caribbean Latin America & Caribbean (excluding high income)Latin America & the Caribbean (IDA & IBRD countries)LatviaLeast developed countries: UN classificationLebanonLesothoLiberiaLibyaLiechtensteinLithuaniaLow & middle incomeLow incomeLower middle incomeLuxembourgMacao SAR, ChinaMacedonia, FYRMadagascarMalawiMalaysiaMaldivesMaliMaltaMarshall IslandsMauritaniaMauritiusMexicoMicronesia, Fed. Sts.Middle East & North AfricaMiddle East & North Africa (excluding high income)Middle East & North Africa (IDA & IBRD countries)Middle incomeMoldovaMongoliaMontenegroMoroccoMozambiqueMyanmarNamibiaNauruNepalNetherlandsNew ZealandNicaraguaNigerNigeriaNorth AmericaNorwayOECD membersOmanOther small statesPacific island small statesPakistanPalauPanamaPapua New GuineaParaguayPeruPhilippinesPolandPortugalPost-demographic dividendPre-demographic dividendPuerto RicoQatarRomaniaRussian FederationRwandaSamoaSan MarinoSao Tome and PrincipeSaudi ArabiaSenegalSerbiaSeychellesSierra LeoneSloveniaSmall statesSolomon IslandsSomaliaSouth AfricaSouth AsiaSouth Asia (IDA & IBRD)South SudanSpainSri LankaSt. Kitts and NevisSt. LuciaSt. Vincent and the GrenadinesSub-Saharan Africa Sub-Saharan Africa (excluding high income)Sub-Saharan Africa (IDA & IBRD countries)SudanSurinameSwazilandSwedenSwitzerlandSyrian Arab RepublicTajikistanTanzaniaThailandTimor-LesteTogoTongaTrinidad and TobagoTunisiaTurkeyTuvaluUgandaUkraineUnited Arab EmiratesUnited KingdomUnited StatesUpper middle incomeUruguayUzbekistanVanuatuVenezuela, RBVietnamWest Bank and GazaWorldYemen, Rep.ZambiaZimbabwe Timeline:
This timeline shows a graph from 1971 to 2015 of Peru. No data until 1970. Number of actual observations by date: 28.
Source name:
World Development Indicators
Source organization:
UNESCO Institute for Statistics
Categories, topics:
Education
Last updated:
apr 23, 2017
Indicators value changes by year
Minimum:
1.202K
jan 1, 2000
Maximum:
525.153K
jan 1, 1971
At the date of observation
Value
Absolute change
Change from previous value
jan 1, 1971
525.153K
+525.153K
0.0%
jan 1, 1974
483.686K
-41.467K
-7.9%
jan 1, 1981
404.469K
-79.217K
-16.38%
jan 1, 1982
258.599K
-145.87K
-36.06%
jan 1, 1983
240.58K
-18.019K
-6.97%
jan 1, 1986
141.679K
-98.901K
-41.11%
jan 1, 1989
293.724K
+152.045K
107.32%
jan 1, 1994
210.415K
-83.309K
-28.36%
jan 1, 1996
394.844K
+184.429K
87.65%
jan 1, 1997
417.381K
+22.537K
5.71%
jan 1, 1998
440.479K
+23.098K
5.53%
jan 1, 1999
7.75K
-432.729K
-98.24%
jan 1, 2000
1.202K
-6.548K
-84.49%
jan 1, 2001
1.671K
+469.0
39.02%
jan 1, 2002
9.083K
+7.412K
443.57%
jan 1, 2003
10.202K
+1.119K
12.32%
jan 1, 2004
16.355K
+6.153K
60.31%
jan 1, 2005
30.906K
+14.551K
88.97%
jan 1, 2006
36.69K
+5.784K
18.71%
jan 1, 2007
37.132K
+442.0
1.2%
jan 1, 2008
38.346K
+1.214K
3.27%
jan 1, 2009
41.651K
+3.305K
8.62%
jan 1, 2010
38.165K
-3.486K
-8.37%
jan 1, 2011
38.266K
+101.0
0.26%
jan 1, 2012
48.614K
+10.348K
27.04%
jan 1, 2013
238.095K
+189.481K
389.77%
jan 1, 2014
145.18K
-92.915K
-39.02%
jan 1, 2015
161.695K
+16.515K
11.38%
Ranking of countries by current statistics by years


Comments: