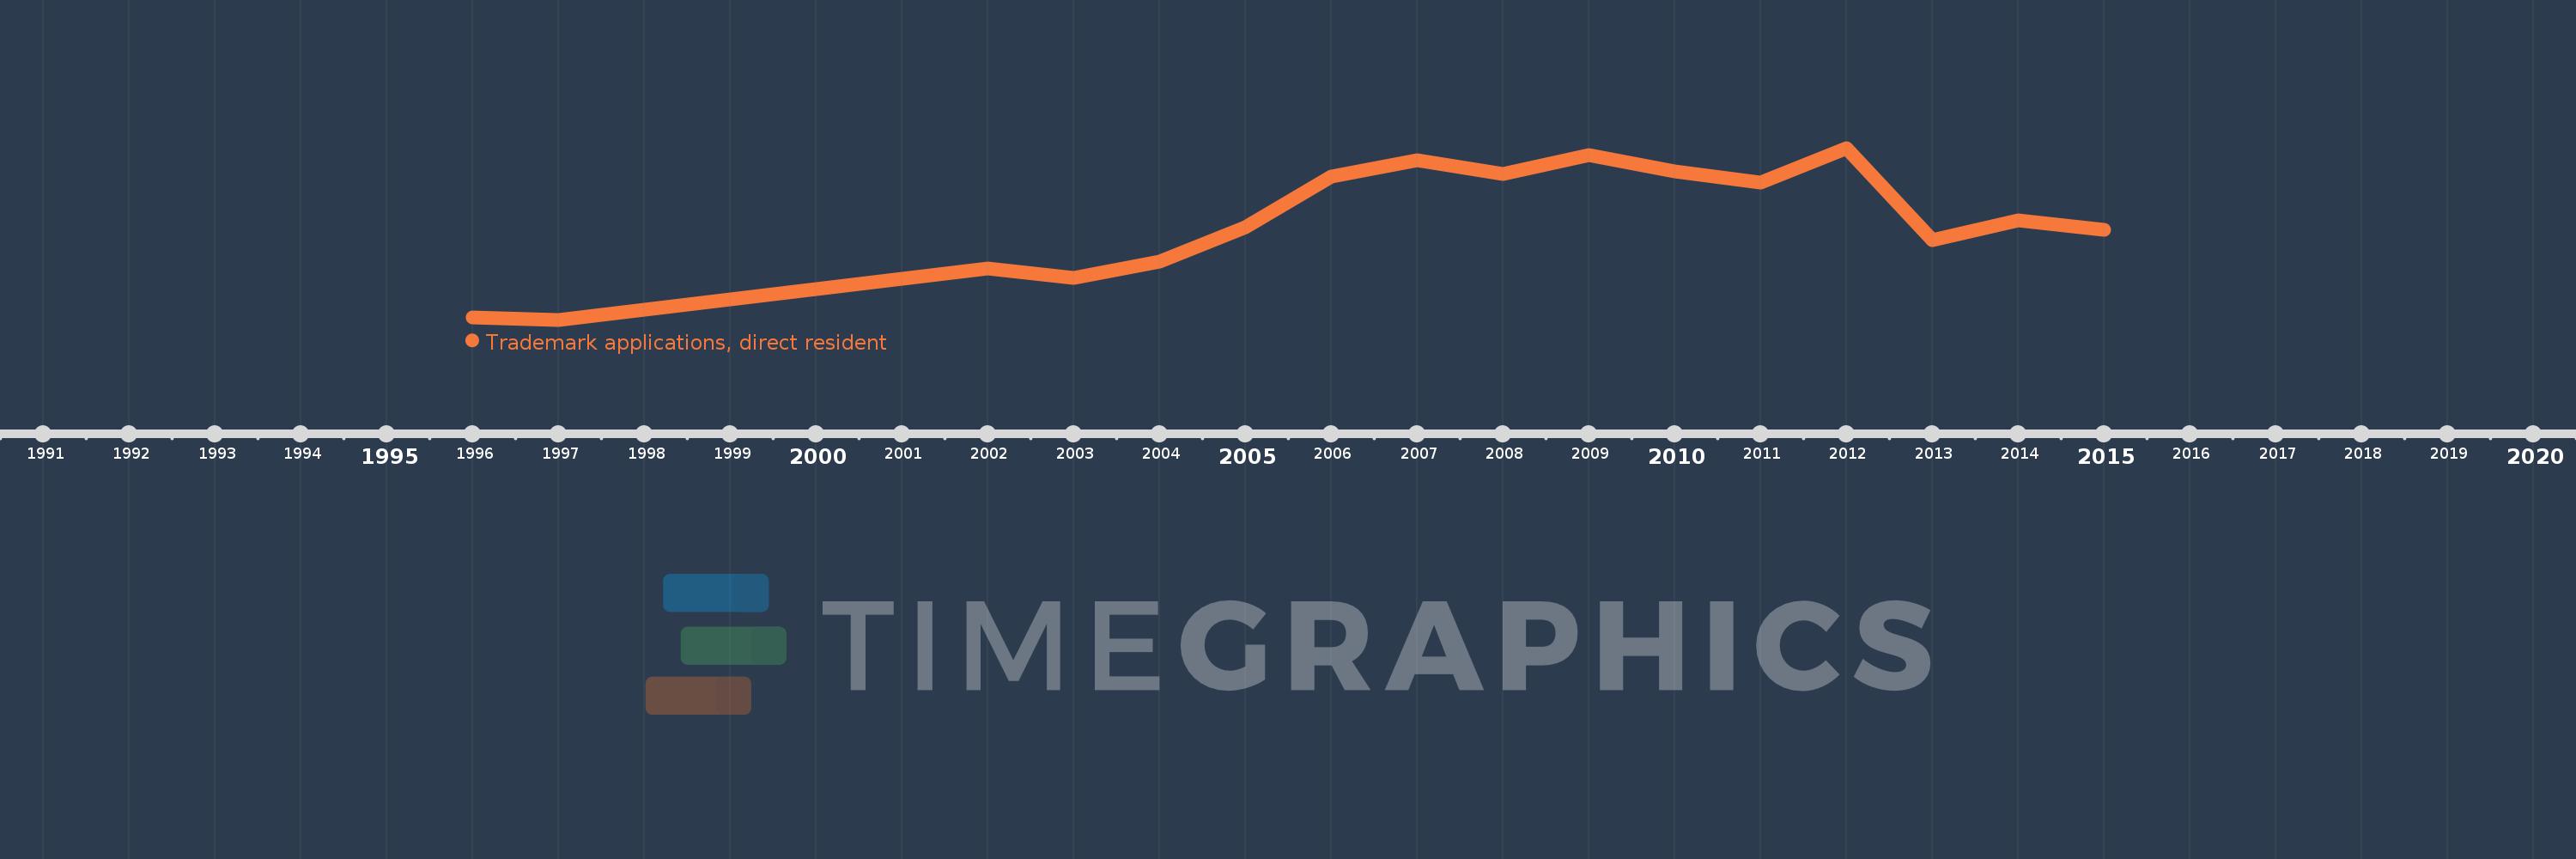
This timeline shows a graph from 1996 to 2015 of Azerbaijan. No data until 1995. Number of actual observations by date: 16.
Source name:
World Development Indicators
Source organization:
World Intellectual Property Organization (WIPO), WIPO Patent Report: Statistics on Worldwide Patent Activity. The International Bureau of WIPO assumes no responsibility with respect to the transformation of these data.
Categories, topics:
Science & Technology
Last updated:
apr 23, 2017
Indicators value changes by year
Meaning:
1.115K
Minimum:
28.0
jan 1, 1997
Maximum:
1.915K
jan 1, 2012
At the date of observation
Value
Absolute change
Change from the previous value
jan 1, 1996
53.0
+53.0
0.0%
jan 1, 1997
28.0
-25.0
-47.17%
jan 1, 2002
591.0
+563.0
2.01K%
jan 1, 2003
485.0
-106.0
-17.94%
jan 1, 2004
671.0
+186.0
38.35%
jan 1, 2005
1.04K
+369.0
54.99%
jan 1, 2006
1.597K
+557.0
53.56%
jan 1, 2007
1.776K
+179.0
11.21%
jan 1, 2008
1.626K
-150.0
-8.45%
jan 1, 2009
1.834K
+208.0
12.79%
jan 1, 2010
1.655K
-179.0
-9.76%
jan 1, 2011
1.532K
-123.0
-7.43%
jan 1, 2012
1.915K
+383.0
25.0%
jan 1, 2013
898.0
-1.017K
-53.11%
jan 1, 2014
1.117K
+219.0
24.39%
jan 1, 2015
1.015K
-102.0
-9.13%
Ranking of countries by current statistics by years
