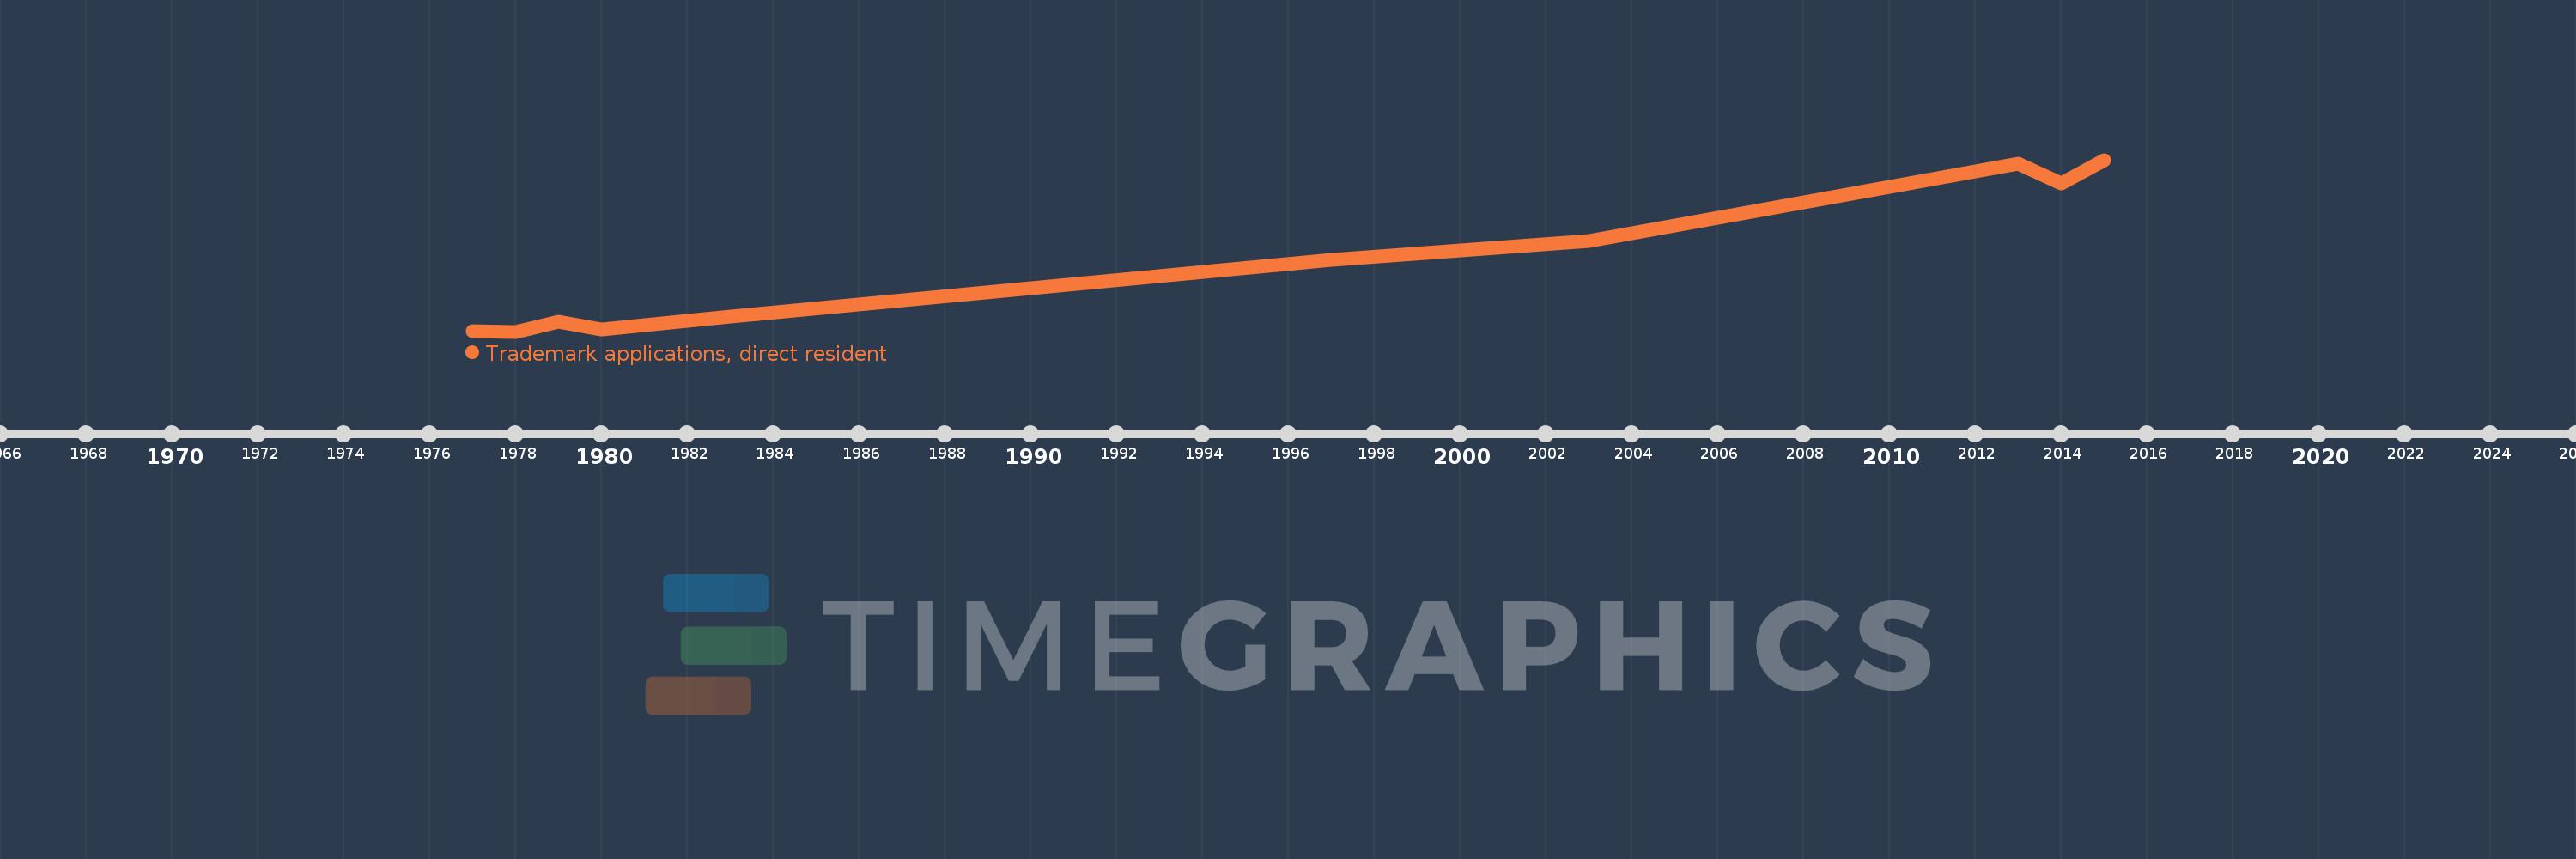
This timeline shows a graph from 1977 to 2015 of Caribbean small states. No data until 1976. Number of actual observations by date: 10.
Source name:
World Development Indicators
Source organization:
World Intellectual Property Organization (WIPO), WIPO Patent Report: Statistics on Worldwide Patent Activity. The International Bureau of WIPO assumes no responsibility with respect to the transformation of these data.
Categories, topics:
Science & Technology
Last updated:
apr 23, 2017
Indicators value changes by year
Meaning:
888.7
Minimum:
182.0
jan 1, 1978
Maximum:
1.976K
jan 1, 2015
At the date of observation
Value
Absolute change
Change from the previous value
jan 1, 1977
188.0
+188.0
0.0%
jan 1, 1978
182.0
-6.0
-3.19%
jan 1, 1979
284.0
+102.0
56.04%
jan 1, 1980
200.0
-84.0
-29.58%
jan 1, 1983
335.0
+135.0
67.5%
jan 1, 1997
929.0
+594.0
177.31%
jan 1, 2003
1.124K
+195.0
20.99%
jan 1, 2013
1.938K
+814.0
72.42%
jan 1, 2014
1.731K
-207.0
-10.68%
jan 1, 2015
1.976K
+245.0
14.15%
Ranking of countries by current statistics by years
