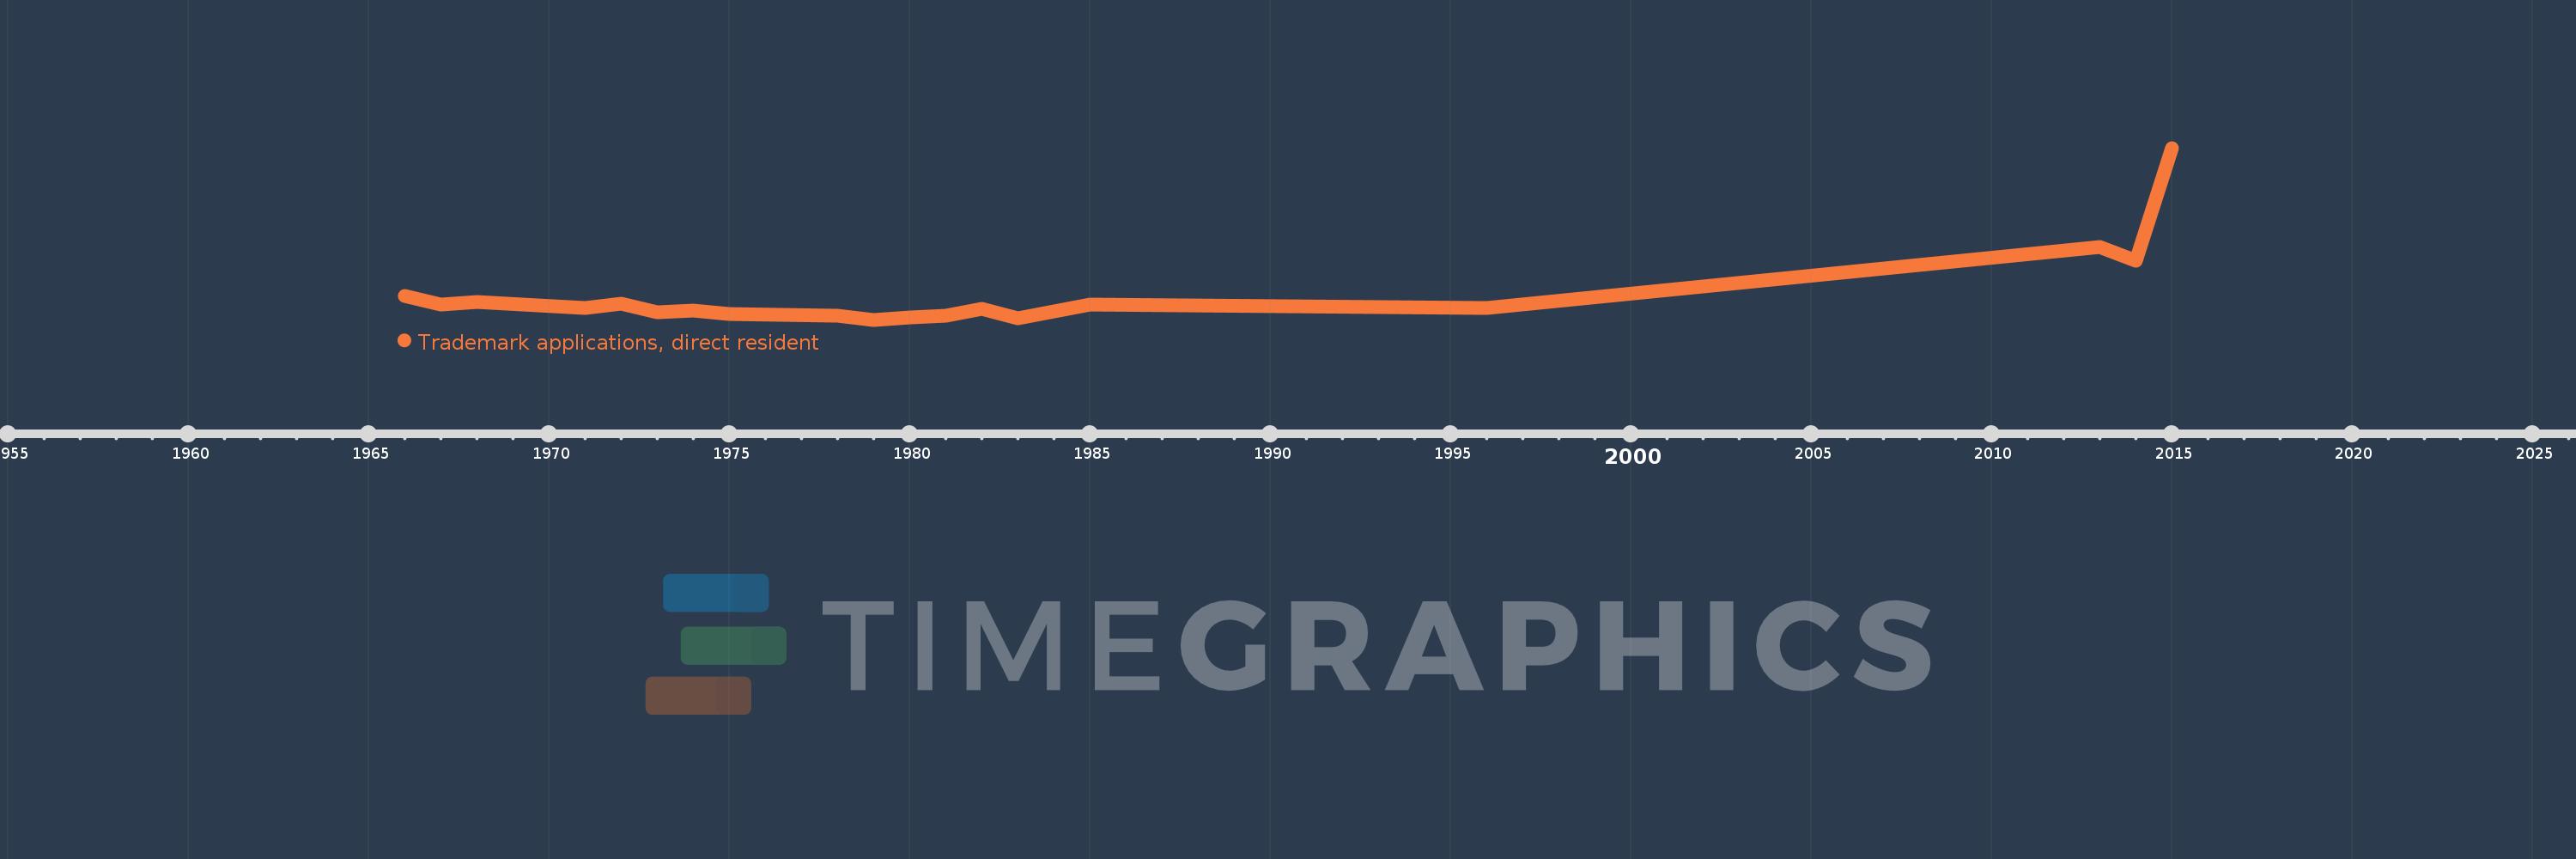
This timeline shows a graph from 1966 to 2015 of Sierra Leone. No data until 1965. Number of actual observations by date: 19.
Source name:
World Development Indicators
Source organization:
World Intellectual Property Organization (WIPO), WIPO Patent Report: Statistics on Worldwide Patent Activity. The International Bureau of WIPO assumes no responsibility with respect to the transformation of these data.
Categories, topics:
Science & Technology
Last updated:
apr 23, 2017
Indicators value changes by year
Meaning:
51.0
Minimum:
2.0
jan 1, 1979
Maximum:
350.0
jan 1, 2015
At the date of observation
Value
Absolute change
Change from the previous value
jan 1, 1966
50.0
+50.0
0.0%
jan 1, 1967
32.0
-18.0
-36.0%
jan 1, 1968
38.0
+6.0
18.75%
jan 1, 1971
26.0
-12.0
-31.58%
jan 1, 1972
34.0
+8.0
30.77%
jan 1, 1973
18.0
-16.0
-47.06%
jan 1, 1974
21.0
+3.0
16.67%
jan 1, 1975
14.0
-7.0
-33.33%
jan 1, 1978
10.0
-4.0
-28.57%
jan 1, 1979
2.0
-8.0
-80.0%
jan 1, 1980
6.0
+4.0
200.0%
jan 1, 1981
10.0
+4.0
66.67%
jan 1, 1982
24.0
+14.0
140.0%
jan 1, 1983
5.0
-19.0
-79.17%
jan 1, 1985
32.0
+27.0
540.0%
jan 1, 1996
25.0
-7.0
-21.88%
jan 1, 2013
150.0
+125.0
500.0%
jan 1, 2014
122.0
-28.0
-18.67%
jan 1, 2015
350.0
+228.0
186.89%
Ranking of countries by current statistics by years
