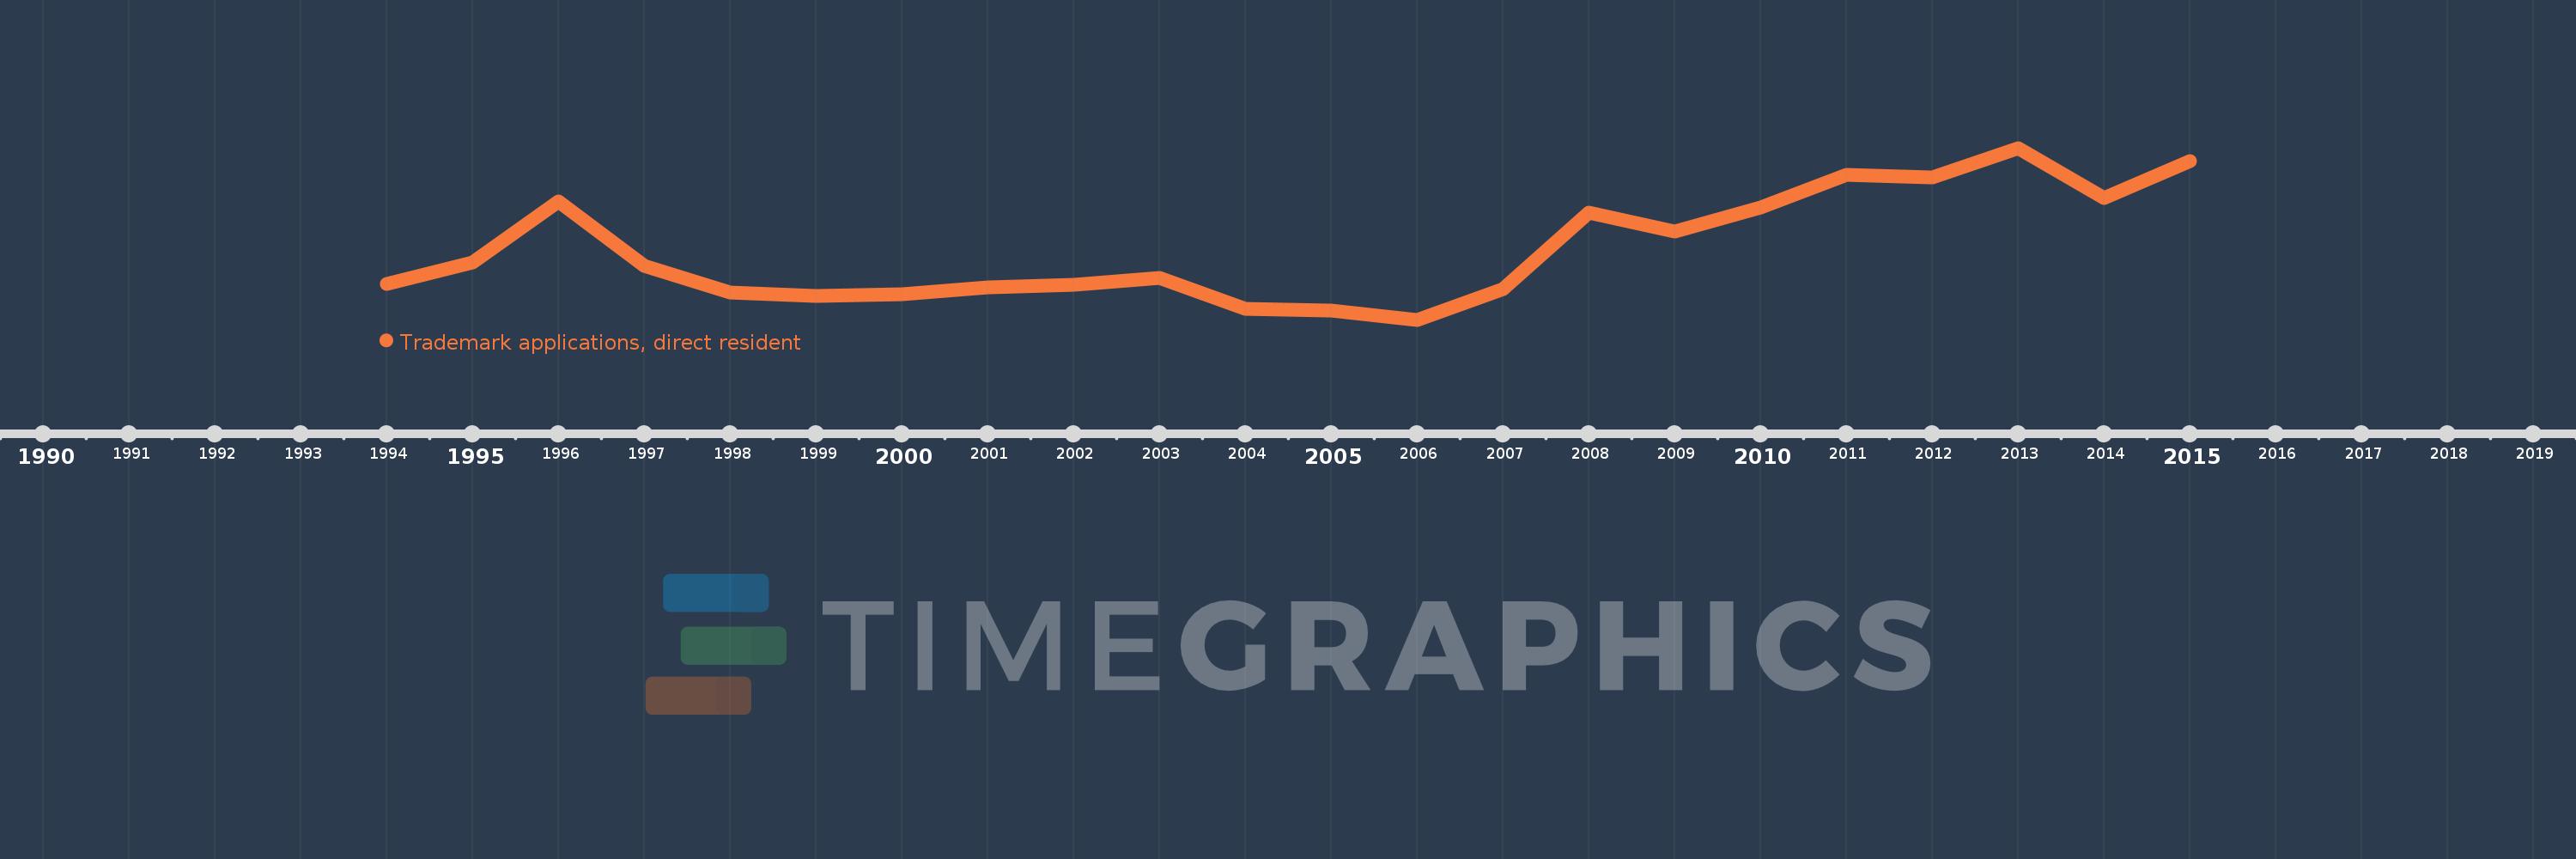
This timeline shows a graph from 1994 to 2015 of Uzbekistan. No data until 1993. Number of actual observations by date: 22.
Source name:
World Development Indicators
Source organization:
World Intellectual Property Organization (WIPO), WIPO Patent Report: Statistics on Worldwide Patent Activity. The International Bureau of WIPO assumes no responsibility with respect to the transformation of these data.
Categories, topics:
Science & Technology
Last updated:
apr 23, 2017
Indicators value changes by year
Meaning:
1.029K
Minimum:
349.0
jan 1, 2006
Maximum:
2.007K
jan 1, 2013
At the date of observation
Value
Absolute change
Change from the previous value
jan 1, 1994
696.0
+696.0
0.0%
jan 1, 1995
901.0
+205.0
29.45%
jan 1, 1996
1.49K
+589.0
65.37%
jan 1, 1997
867.0
-623.0
-41.81%
jan 1, 1998
614.0
-253.0
-29.18%
jan 1, 1999
581.0
-33.0
-5.37%
jan 1, 2000
596.0
+15.0
2.58%
jan 1, 2001
662.0
+66.0
11.07%
jan 1, 2002
690.0
+28.0
4.23%
jan 1, 2003
756.0
+66.0
9.57%
jan 1, 2004
454.0
-302.0
-39.95%
jan 1, 2005
438.0
-16.0
-3.52%
jan 1, 2006
349.0
-89.0
-20.32%
jan 1, 2007
643.0
+294.0
84.24%
jan 1, 2008
1.382K
+739.0
114.93%
jan 1, 2009
1.204K
-178.0
-12.88%
jan 1, 2010
1.431K
+227.0
18.85%
jan 1, 2011
1.75K
+319.0
22.29%
jan 1, 2012
1.72K
-30.0
-1.71%
jan 1, 2013
2.007K
+287.0
16.69%
jan 1, 2014
1.523K
-484.0
-24.12%
jan 1, 2015
1.884K
+361.0
23.7%
Ranking of countries by current statistics by years
