30
/
AIzaSyAYiBZKx7MnpbEhh9jyipgxe19OcubqV5w
April 1, 2024
131278
Ethiopia
ETH
true
2
1
Trademark applications, direct resident
2008,2007,2006,2005,2004,2003,2002,2001,2000,1999,1996,1995,1994,1992,1991,1990,1989,1987,1985
Download
Global statistics library →Ethiopia →

Trademark applications, direct resident

This statistics in other country:

AlbaniaAlgeriaAndorraAngolaArab WorldArgentinaArmeniaArubaAustraliaAustriaAzerbaijanBahamas, TheBahrainBangladeshBarbadosBelarusBelgiumBelizeBhutanBoliviaBosnia and HerzegovinaBotswanaBrazilBrunei DarussalamBulgariaBurkina FasoBurundiCabo VerdeCambodiaCanadaCaribbean small statesCentral Europe and the BalticsChileChinaColombiaCongo, Dem. Rep.Costa RicaCroatiaCubaCuracaoCyprusCzech RepublicDenmarkDjiboutiDominicaDominican RepublicEarly-demographic dividendEast Asia & PacificEast Asia & Pacific (excluding high income)East Asia & Pacific (IDA & IBRD countries)EcuadorEgypt, Arab Rep.El SalvadorEstoniaEthiopiaEuro areaEurope & Central AsiaEurope & Central Asia (excluding high income)Europe & Central Asia (IDA & IBRD countries)European UnionFijiFinlandFranceGambia, TheGeorgiaGermanyGhanaGreeceGrenadaGuatemalaGuineaGuinea-BissauGuyanaHaitiHigh incomeHondurasHong Kong SAR, ChinaHungaryIBRD onlyIcelandIDA & IBRD totalIDA blendIndiaIndonesiaIran, Islamic Rep.IraqIrelandIsraelItalyJamaicaJapanJordanKazakhstanKenyaKorea, Dem. People’s Rep.Korea, Rep.KuwaitKyrgyz RepublicLao PDRLate-demographic dividendLatin America & Caribbean Latin America & Caribbean (excluding high income)Latin America & the Caribbean (IDA & IBRD countries)LatviaLebanonLesothoLiberiaLibyaLiechtensteinLithuaniaLow & middle incomeLower middle incomeLuxembourgMacao SAR, ChinaMacedonia, FYRMadagascarMalawiMalaysiaMaldivesMaliMaltaMauritiusMexicoMiddle East & North AfricaMiddle East & North Africa (excluding high income)Middle East & North Africa (IDA & IBRD countries)Middle incomeMoldovaMonacoMongoliaMontenegroMoroccoMozambiqueMyanmarNamibiaNepalNetherlandsNew ZealandNicaraguaNigeriaNorth AmericaNorwayOECD membersOmanPakistanPanamaPapua New GuineaParaguayPeruPhilippinesPolandPortugalPost-demographic dividendQatarRomaniaRussian FederationRwandaSamoaSan MarinoSao Tome and PrincipeSaudi ArabiaSerbiaSeychellesSierra LeoneSingaporeSlovak RepublicSloveniaSomaliaSouth AfricaSouth AsiaSouth Asia (IDA & IBRD)SpainSri LankaSt. LuciaSt. Vincent and the GrenadinesSudanSurinameSwazilandSwedenSwitzerlandSyrian Arab RepublicTajikistanTanzaniaThailandTongaTrinidad and TobagoTunisiaTurkeyTurkmenistanUgandaUkraineUnited Arab EmiratesUnited KingdomUnited StatesUpper middle incomeUruguayUzbekistanVenezuela, RBVietnamWorldYemen, Rep.ZambiaZimbabwe

Timeline:

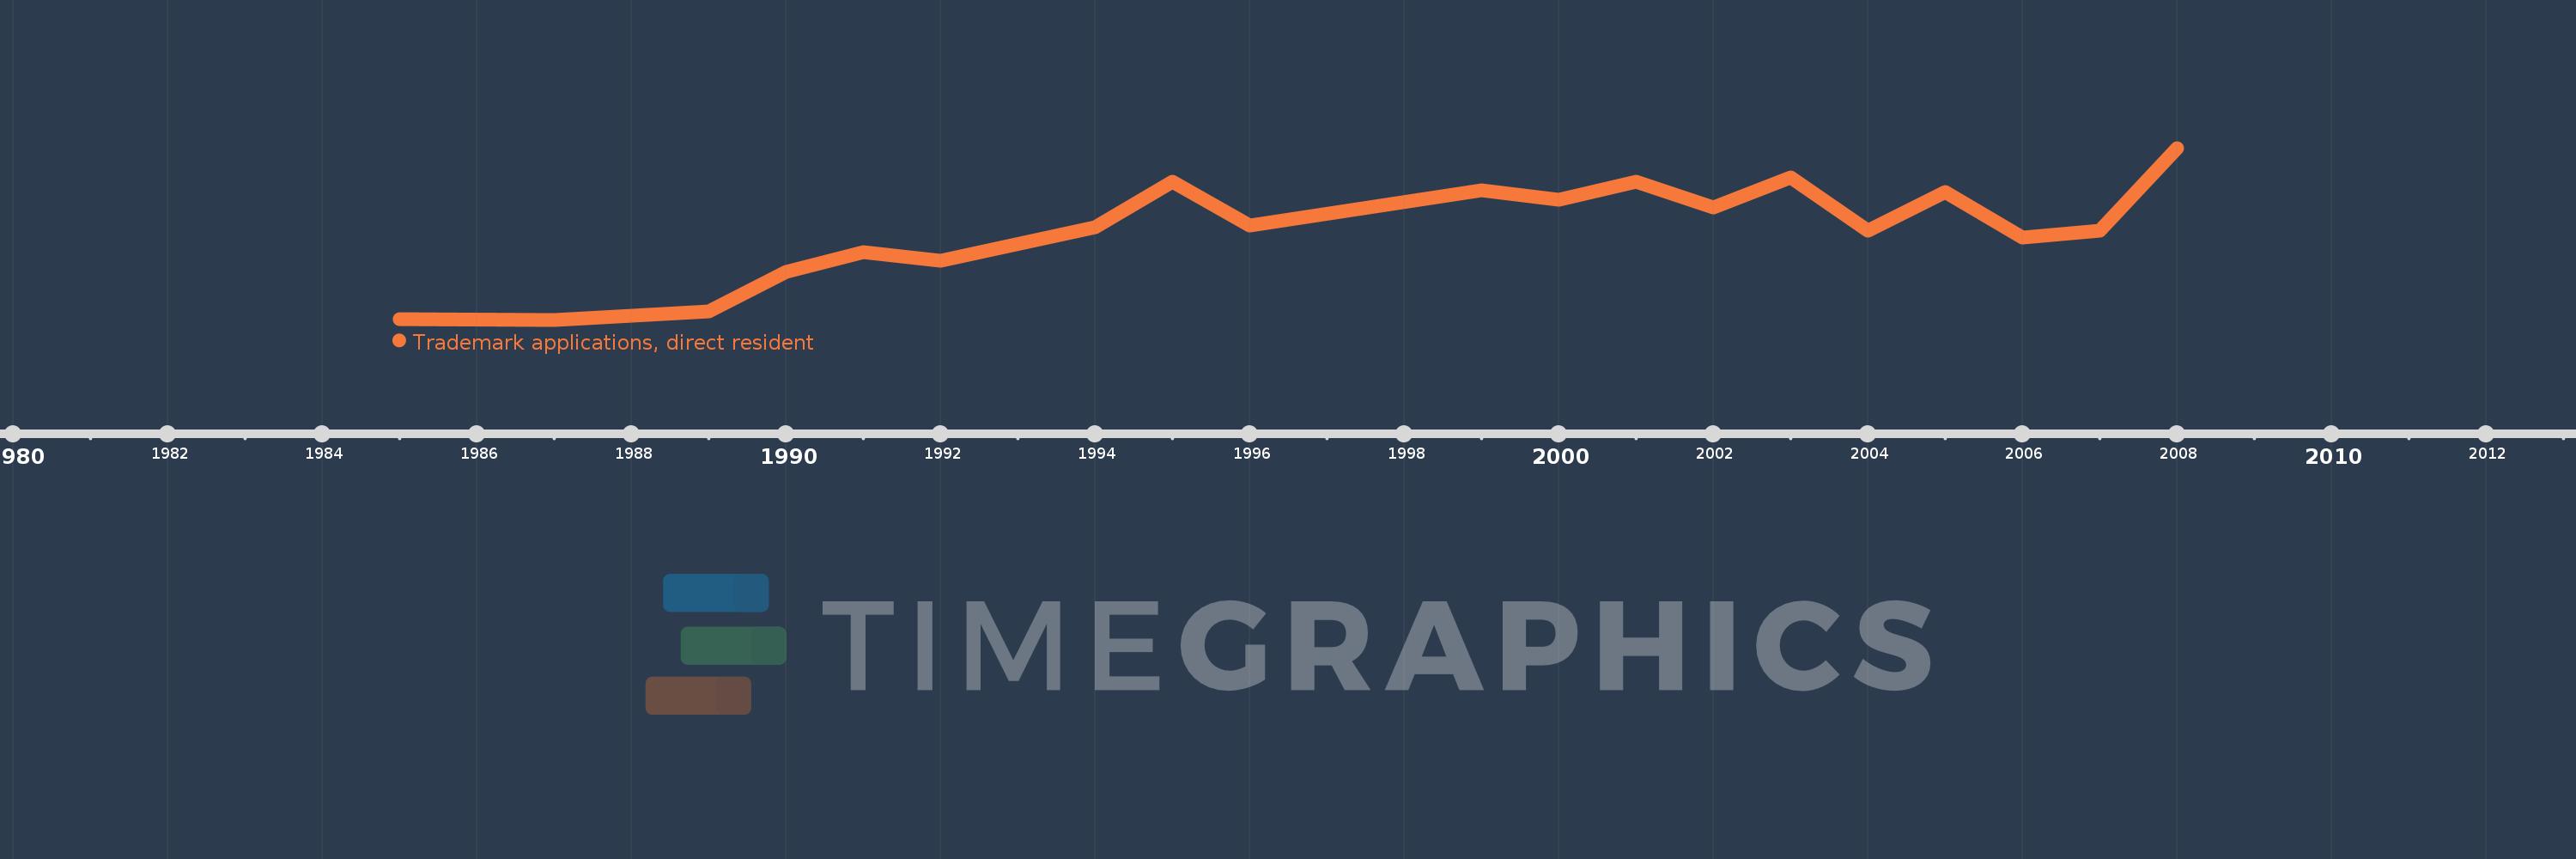
This timeline shows a graph from 1985 to 2008 of Ethiopia. No data until 1984. Number of actual observations by date: 19.

Source name:

World Development Indicators

Source organization:

World Intellectual Property Organization (WIPO), WIPO Patent Report: Statistics on Worldwide Patent Activity. The International Bureau of WIPO assumes no responsibility with respect to the transformation of these data.

Categories, topics:

Science & Technology

Last updated:

apr 23, 2017

Indicators value changes by year

Meaning:
229.737
Minimum:
14.0
jan 1, 1987
Maximum:
426.0
jan 1, 2008
At the date of observation
Value
Absolute change
Change from the previous value
jan 1, 1985
15.0
+15.0
0.0%
jan 1, 1987
14.0
-1.0
-6.67%
jan 1, 1989
34.0
+20.0
142.86%
jan 1, 1990
128.0
+94.0
276.47%
jan 1, 1991
177.0
+49.0
38.28%
jan 1, 1992
156.0
-21.0
-11.86%
jan 1, 1994
235.0
+79.0
50.64%
jan 1, 1995
345.0
+110.0
46.81%
jan 1, 1996
239.0
-106.0
-30.72%
jan 1, 1999
324.0
+85.0
35.56%
jan 1, 2000
302.0
-22.0
-6.79%
jan 1, 2001
346.0
+44.0
14.57%
jan 1, 2002
283.0
-63.0
-18.21%
jan 1, 2003
355.0
+72.0
25.44%
jan 1, 2004
227.0
-128.0
-36.06%
jan 1, 2005
321.0
+94.0
41.41%
jan 1, 2006
211.0
-110.0
-34.27%
jan 1, 2007
227.0
+16.0
7.58%
jan 1, 2008
426.0
+199.0
87.67%

Ranking of countries by current statistics by years