29
/
en
AIzaSyAYiBZKx7MnpbEhh9jyipgxe19OcubqV5w
April 1, 2024
74397
Austria
AUT
true
2
1
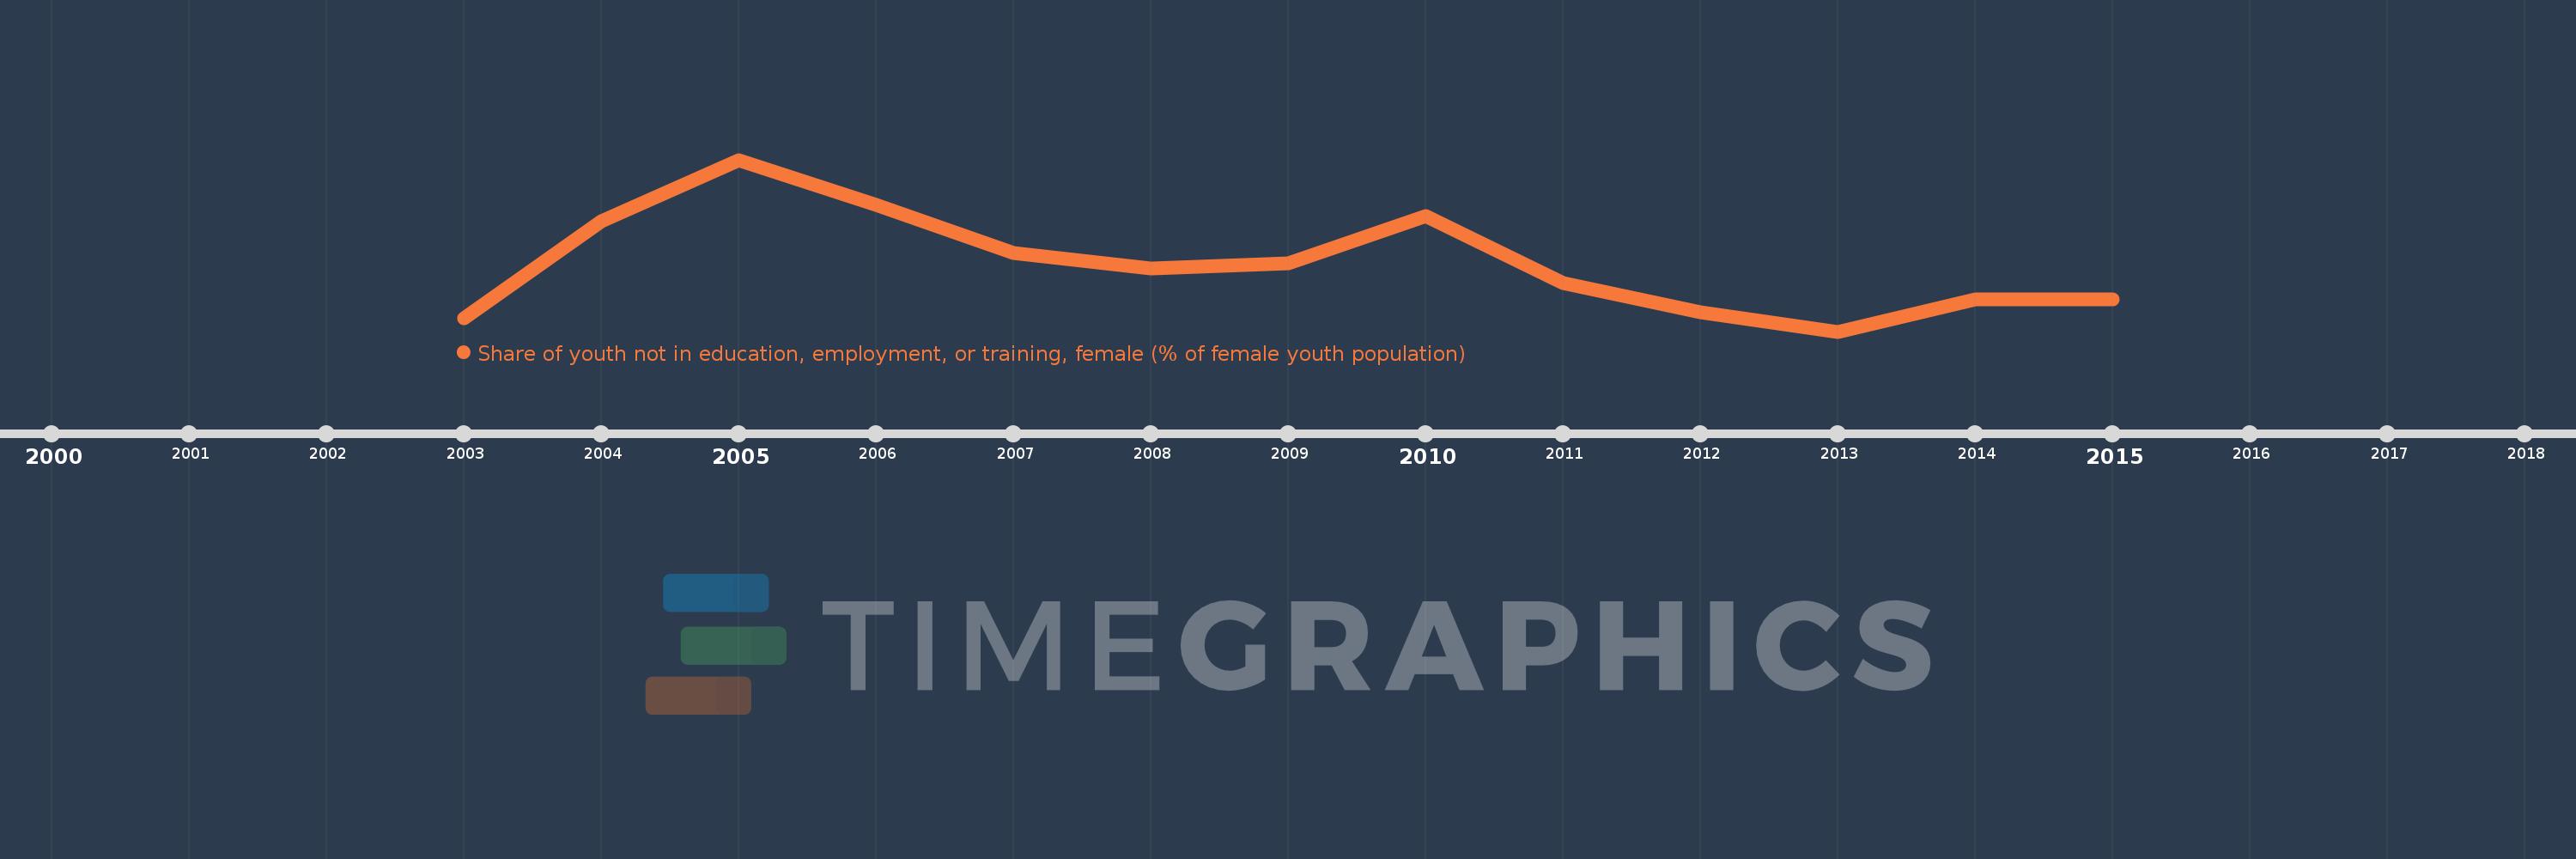
Share of youth not in education, employment, or training, female (% of female youth population)
2015,2014,2013,2012,2011,2010,2009,2008,2007,2006,2005,2004,2003
This statistics in other country:
Timeline:
This timeline shows a graph from 2003 to 2015 of Austria. No data until 2002. Number of actual observations by date: 13.
Source name:
World Development Indicators
Source organization:
International Labour Organization, Key Indicators of the Labour Market database.
Categories, topics:
Social Protection & Labor
Last updated:
apr 23, 2017
Indicators value changes by year
At the date of observation
Value
Absolute change
Change from previous value
jan 1, 2003
7.16
+7.16
0.0%
jan 1, 2004
8.58
+1.42
19.83%
jan 1, 2005
9.49
+0.91
10.61%
jan 1, 2006
8.83
-0.66
-6.95%
jan 1, 2007
8.12
-0.71
-8.04%
jan 1, 2008
7.89
-0.23
-2.83%
jan 1, 2009
7.97
+0.08
1.01%
jan 1, 2010
8.66
+0.69
8.66%
jan 1, 2011
7.68
-0.98
-11.32%
jan 1, 2012
7.25
-0.43
-5.6%
jan 1, 2013
6.96
-0.29
-4.0%
jan 1, 2014
7.44
+0.48
6.9%
jan 1, 2015
7.43
-0.01
-0.13%
Ranking of countries by current statistics by years


Comments: