29
/
en
AIzaSyAYiBZKx7MnpbEhh9jyipgxe19OcubqV5w
April 1, 2024
256838
Sweden
SWE
true
2
1
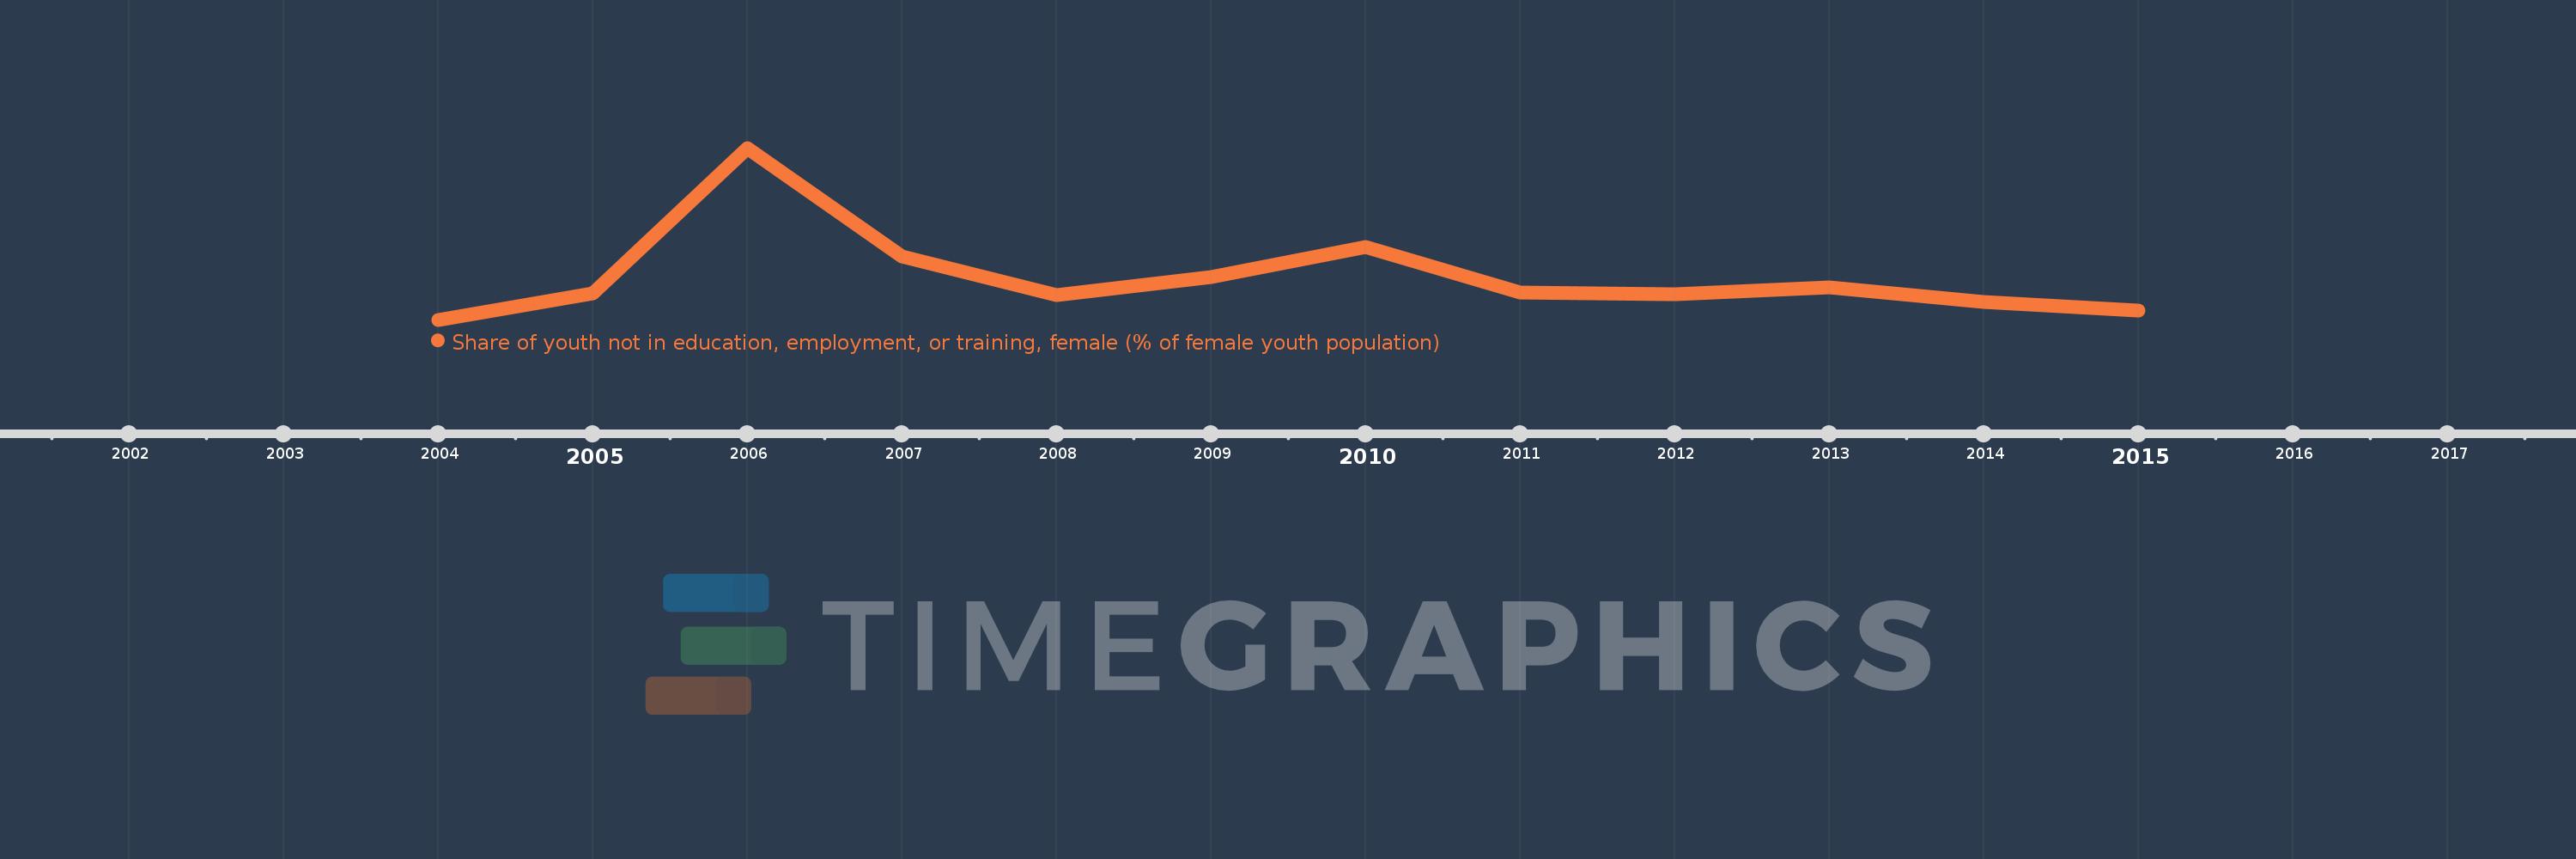
Share of youth not in education, employment, or training, female (% of female youth population)
2015,2014,2013,2012,2011,2010,2009,2008,2007,2006,2005,2004
This statistics in other country:
Timeline:
This timeline shows a graph from 2004 to 2015 of Sweden. No data until 2003. Number of actual observations by date: 12.
Source name:
World Development Indicators
Source organization:
International Labour Organization, Key Indicators of the Labour Market database.
Categories, topics:
Social Protection & Labor
Last updated:
apr 23, 2017
Indicators value changes by year
At the date of observation
Value
Absolute change
Change from previous value
jan 1, 2004
6.42
+6.42
0.0%
jan 1, 2005
7.53
+1.11
17.29%
jan 1, 2006
13.56
+6.03
80.08%
jan 1, 2007
9.04
-4.52
-33.33%
jan 1, 2008
7.44
-1.6
-17.7%
jan 1, 2009
8.18
+0.74
9.95%
jan 1, 2010
9.45
+1.27
15.53%
jan 1, 2011
7.55
-1.9
-20.11%
jan 1, 2012
7.49
-0.06
-0.79%
jan 1, 2013
7.78
+0.29
3.87%
jan 1, 2014
7.15
-0.63
-8.1%
jan 1, 2015
6.79
-0.36
-5.03%
Ranking of countries by current statistics by years


Comments: