29
/
en
AIzaSyAYiBZKx7MnpbEhh9jyipgxe19OcubqV5w
April 1, 2024
161983
Italy
ITA
true
2
1
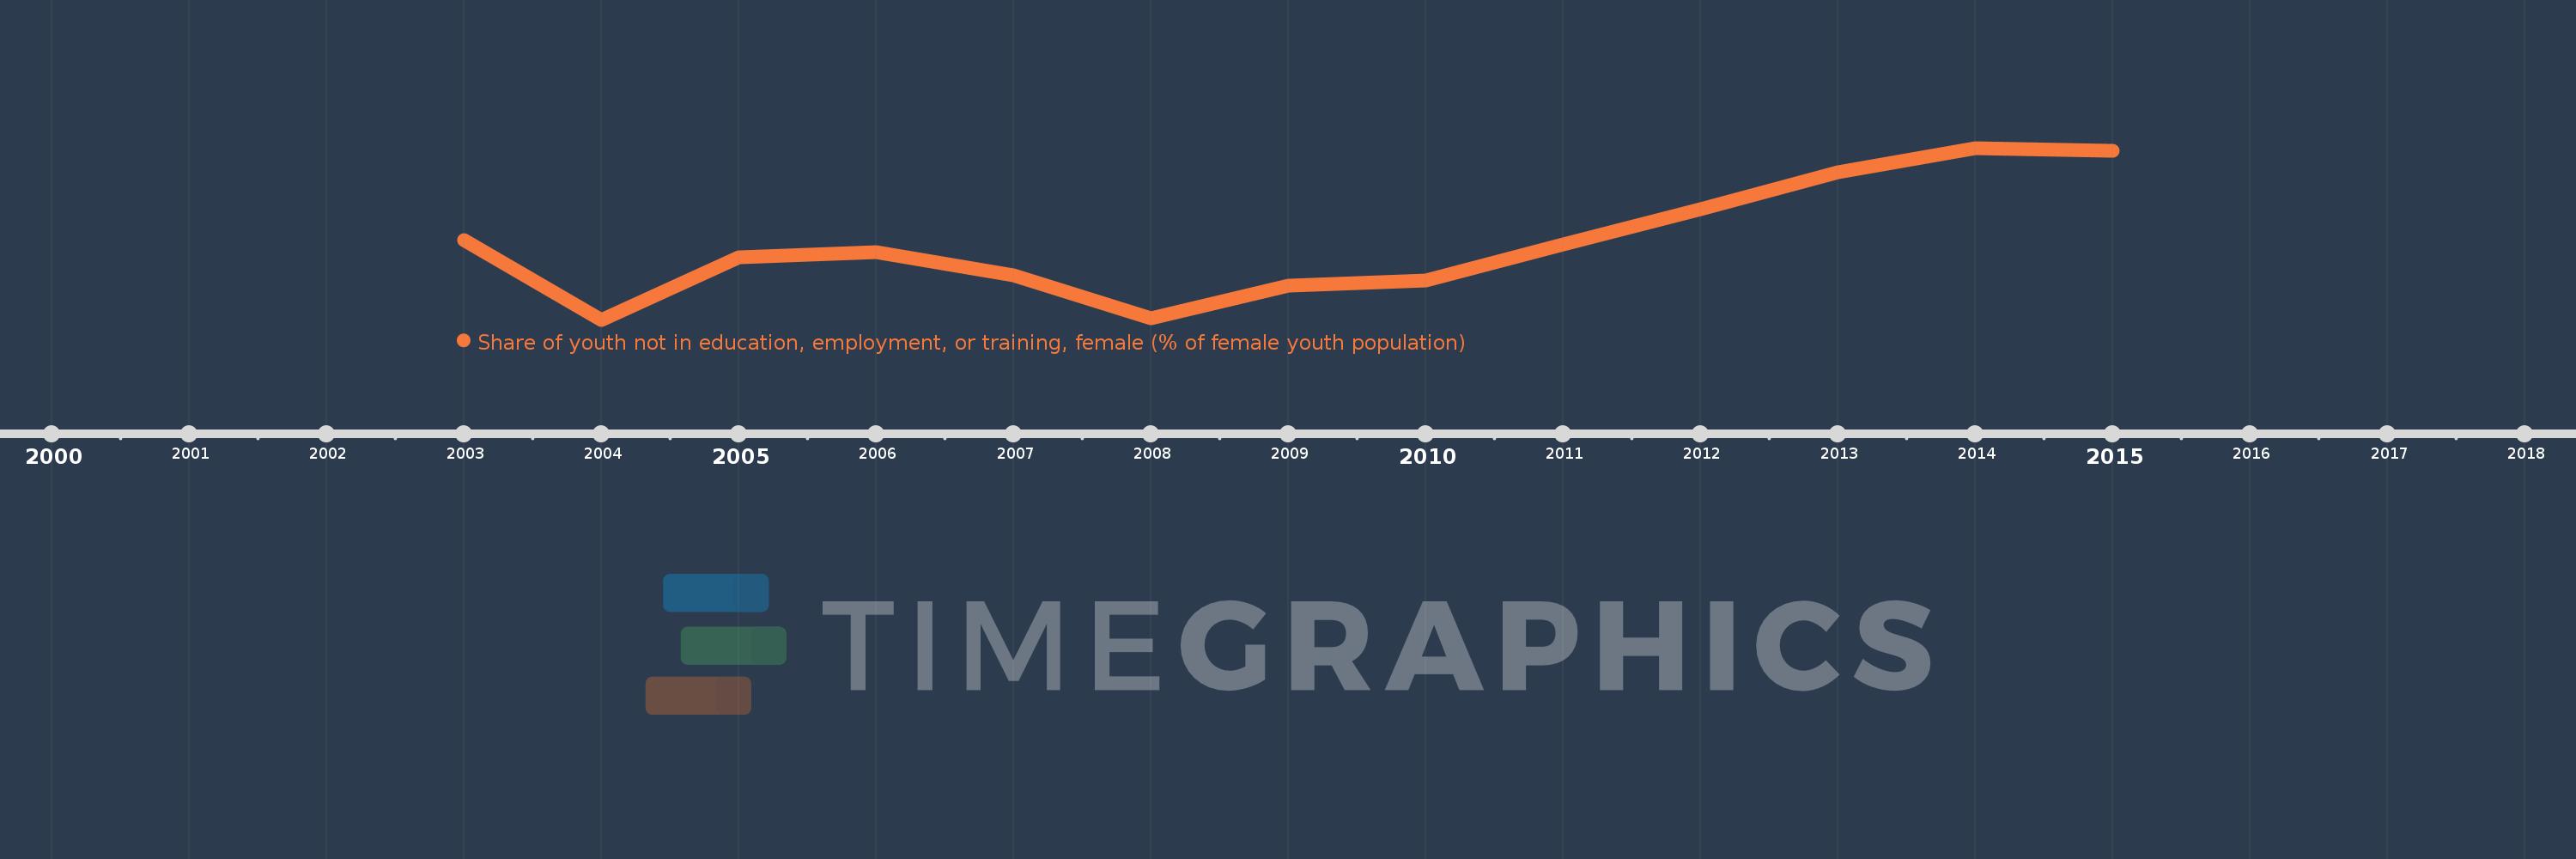
Share of youth not in education, employment, or training, female (% of female youth population)
2015,2014,2013,2012,2011,2010,2009,2008,2007,2006,2005,2004,2003
This statistics in other country:
Timeline:
This timeline shows a graph from 2003 to 2015 of Italy. No data until 2002. Number of actual observations by date: 13.
Source name:
World Development Indicators
Source organization:
International Labour Organization, Key Indicators of the Labour Market database.
Categories, topics:
Social Protection & Labor
Last updated:
apr 23, 2017
Indicators value changes by year
At the date of observation
Value
Absolute change
Change from previous value
jan 1, 2003
19.13
+19.13
0.0%
jan 1, 2004
17.14
-1.99
-10.4%
jan 1, 2005
18.7
+1.56
9.1%
jan 1, 2006
18.83
+0.13
0.7%
jan 1, 2007
18.24
-0.59
-3.13%
jan 1, 2008
17.17
-1.07
-5.87%
jan 1, 2009
17.99
+0.82
4.78%
jan 1, 2010
18.13
+0.14
0.78%
jan 1, 2011
19.02
+0.89
4.91%
jan 1, 2012
19.9
+0.88
4.63%
jan 1, 2013
20.82
+0.92
4.62%
jan 1, 2014
21.43
+0.61
2.93%
jan 1, 2015
21.36
-0.07
-0.33%
Ranking of countries by current statistics by years


Comments: