29
/
en
AIzaSyAYiBZKx7MnpbEhh9jyipgxe19OcubqV5w
April 1, 2024
55171
Post-demographic dividend
PST
false
2
1
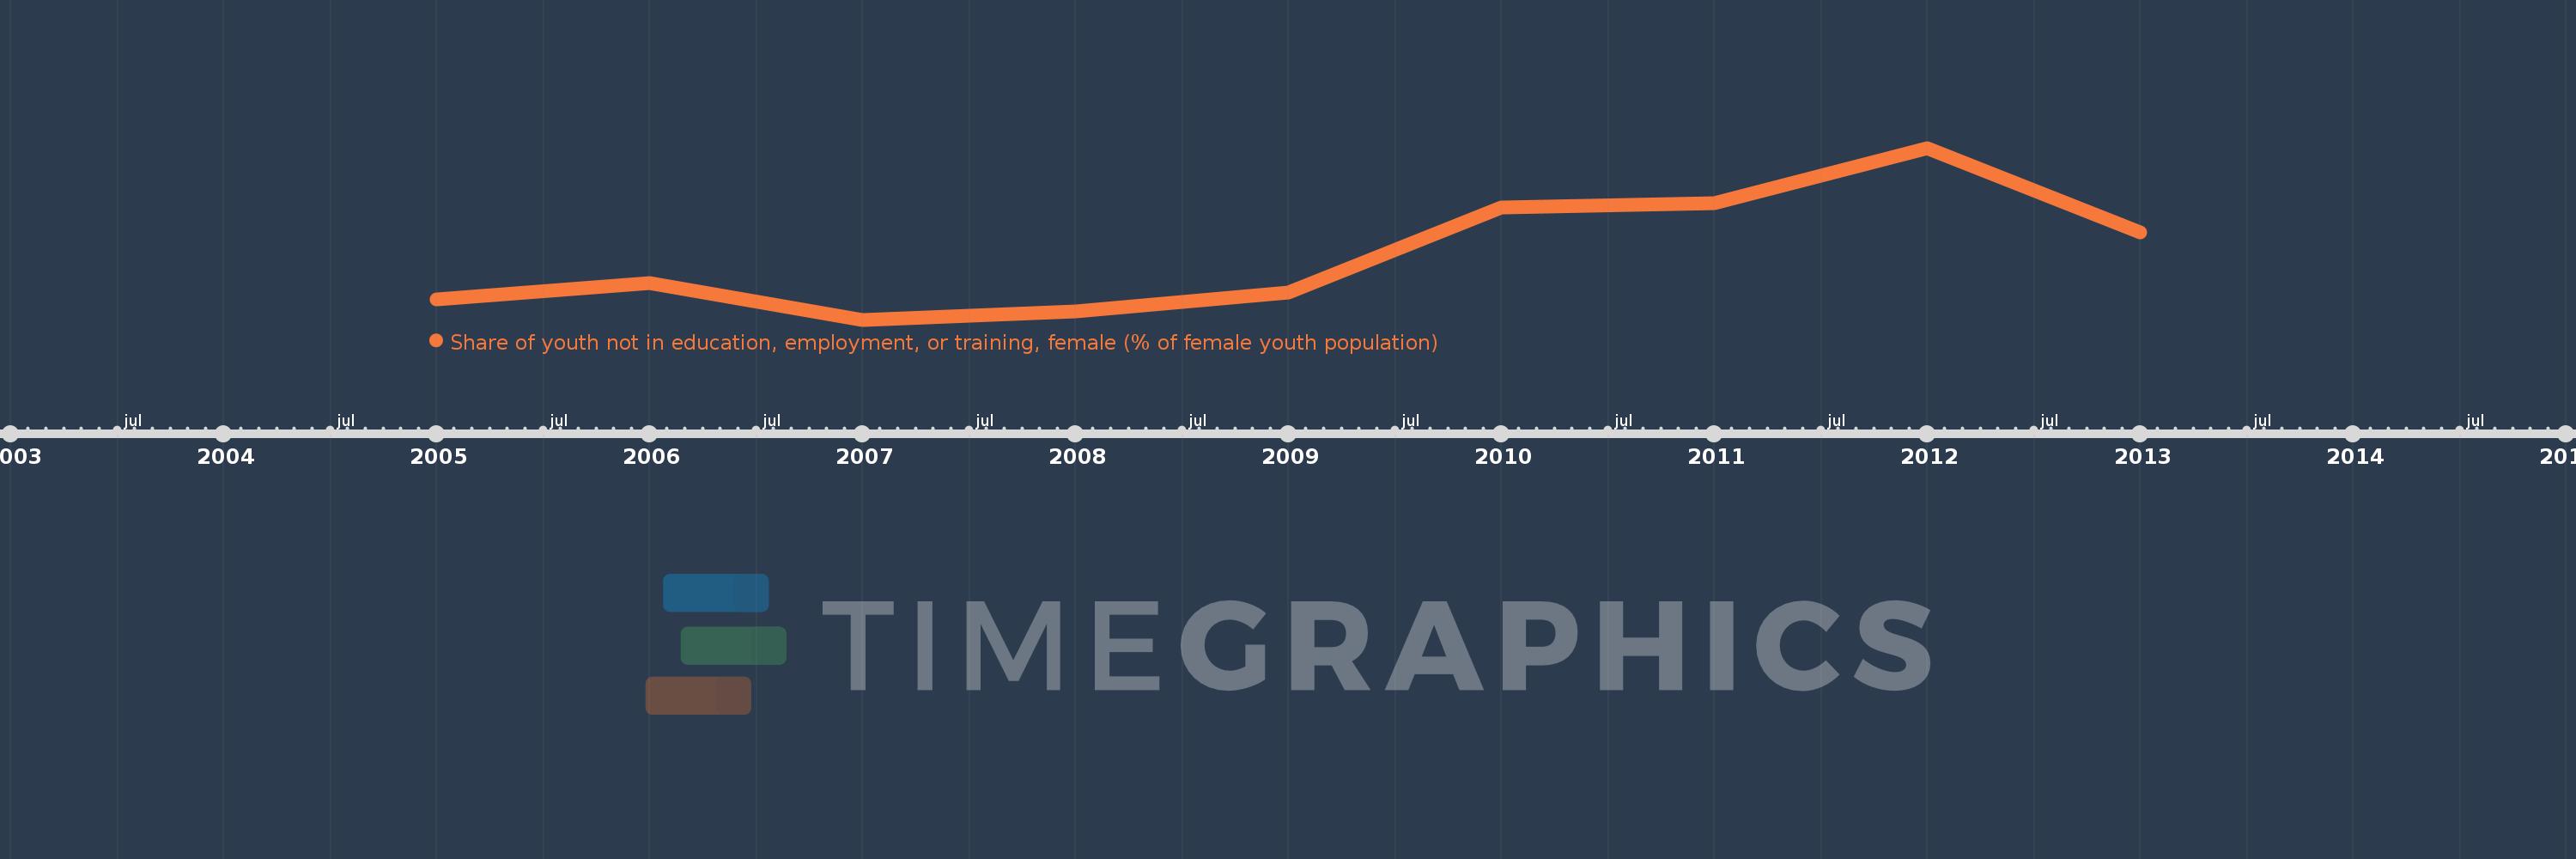
Share of youth not in education, employment, or training, female (% of female youth population)
2013,2012,2011,2010,2009,2008,2007,2006,2005
This statistics in other country:
Timeline:
This timeline shows a graph from 2005 to 2013 of Post-demographic dividend. No data until 2004. Number of actual observations by date: 9.
Source name:
World Development Indicators
Source organization:
International Labour Organization, Key Indicators of the Labour Market database.
Categories, topics:
Social Protection & Labor
Last updated:
apr 23, 2017
Indicators value changes by year
At the date of observation
Value
Absolute change
Change from previous value
jan 1, 2005
12.507
+12.507
0.0%
jan 1, 2006
12.789
+0.282
2.25%
jan 1, 2007
12.14
-0.649
-5.07%
jan 1, 2008
12.293
+0.152
1.26%
jan 1, 2009
12.616
+0.324
2.63%
jan 1, 2010
14.132
+1.516
12.02%
jan 1, 2011
14.211
+0.078
0.55%
jan 1, 2012
15.19
+0.98
6.89%
jan 1, 2013
13.687
-1.504
-9.9%
Ranking of countries by current statistics by years


Comments: