29
/
en
AIzaSyAYiBZKx7MnpbEhh9jyipgxe19OcubqV5w
April 1, 2024
26138
Central Europe and the Baltics
CEB
false
2
1
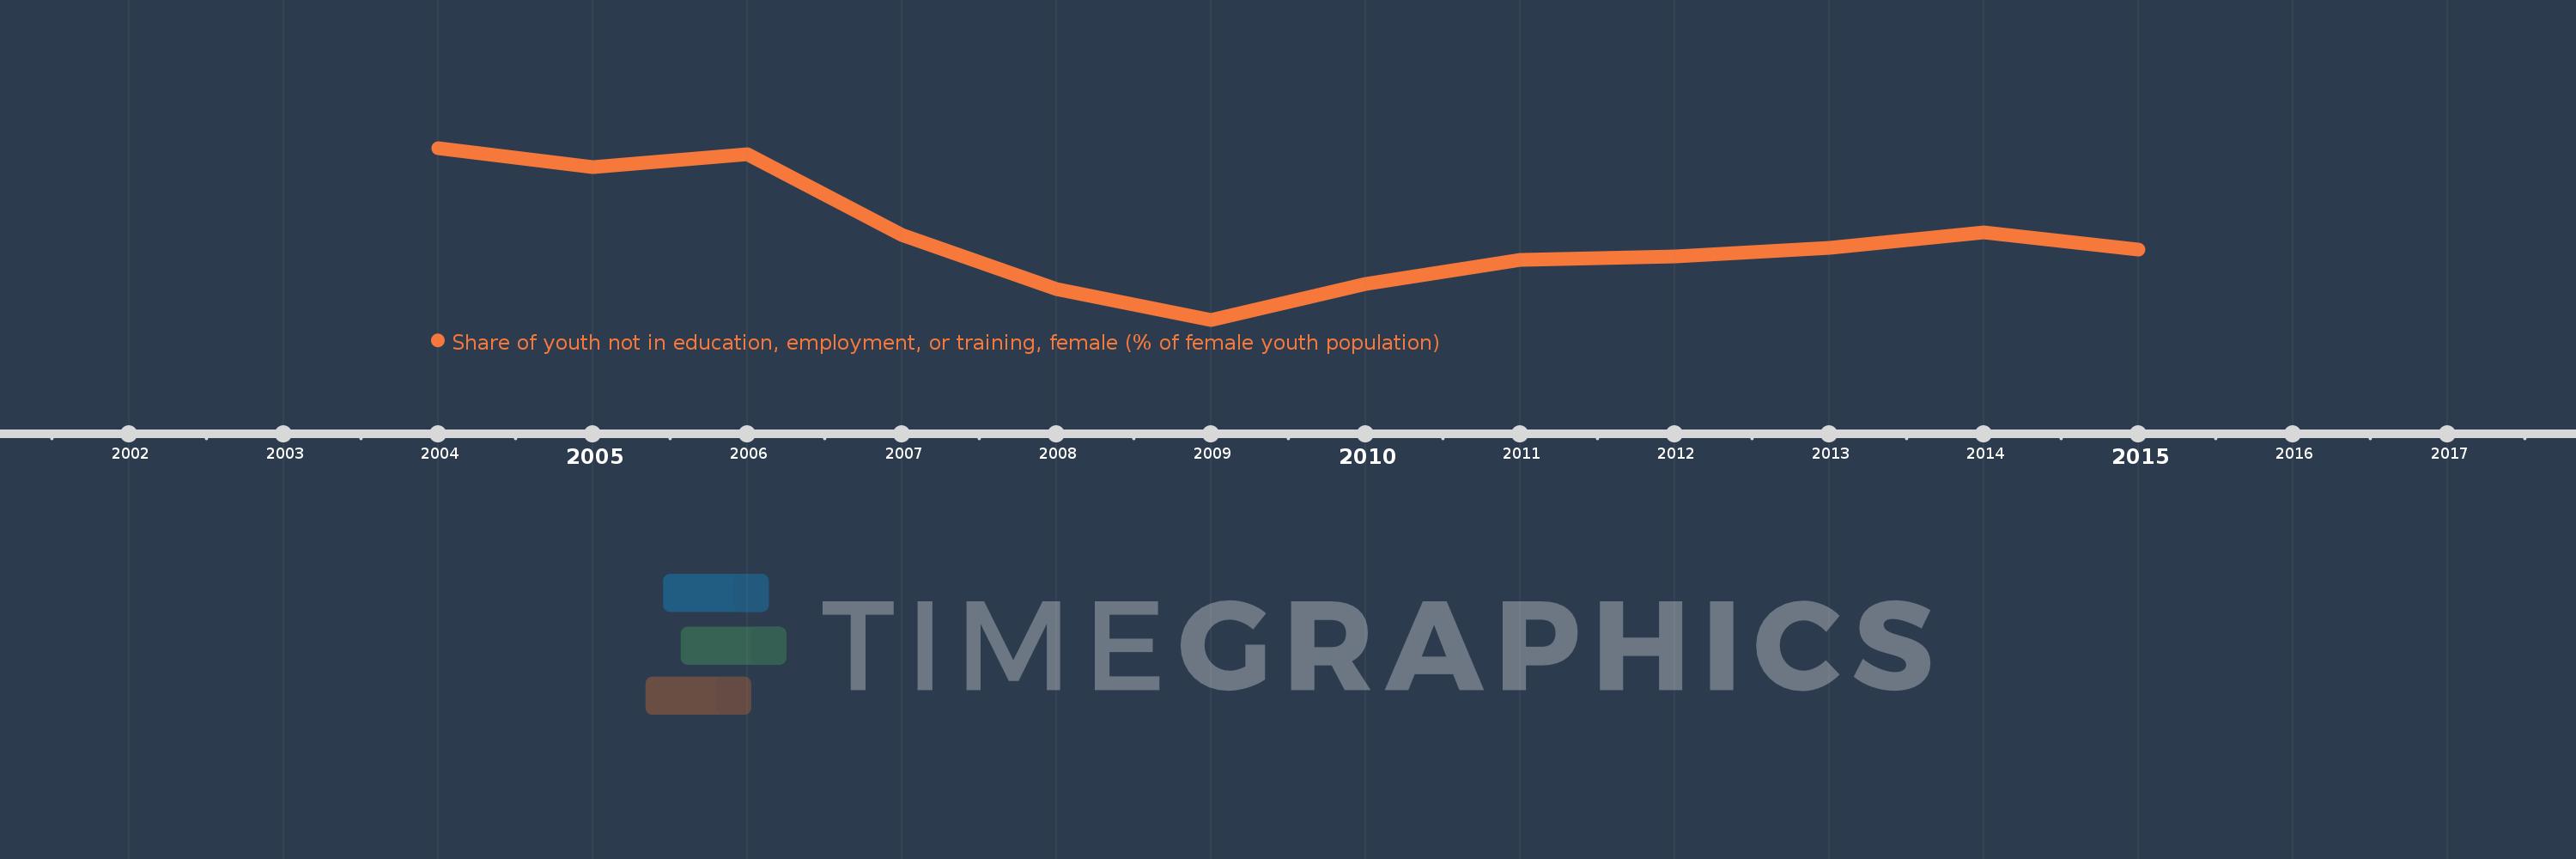
Share of youth not in education, employment, or training, female (% of female youth population)
2015,2014,2013,2012,2011,2010,2009,2008,2007,2006,2005,2004
This statistics in other country:
Timeline:
This timeline shows a graph from 2004 to 2015 of Central Europe and the Baltics. No data until 2003. Number of actual observations by date: 12.
Source name:
World Development Indicators
Source organization:
International Labour Organization, Key Indicators of the Labour Market database.
Categories, topics:
Social Protection & Labor
Last updated:
apr 23, 2017
Indicators value changes by year
Minimum:
12.082
jan 1, 2009
Maximum:
16.888
jan 1, 2004
At the date of observation
Value
Absolute change
Change from previous value
jan 1, 2004
16.888
+16.888
0.0%
jan 1, 2005
16.361
-0.527
-3.12%
jan 1, 2006
16.715
+0.354
2.16%
jan 1, 2007
14.458
-2.257
-13.5%
jan 1, 2008
12.932
-1.526
-10.55%
jan 1, 2009
12.082
-0.85
-6.57%
jan 1, 2010
13.074
+0.992
8.21%
jan 1, 2011
13.752
+0.678
5.18%
jan 1, 2012
13.842
+0.09
0.65%
jan 1, 2013
14.102
+0.26
1.88%
jan 1, 2014
14.524
+0.422
2.99%
jan 1, 2015
14.039
-0.485
-3.34%
Ranking of countries by current statistics by years


Comments: