29
/
en
AIzaSyAYiBZKx7MnpbEhh9jyipgxe19OcubqV5w
April 1, 2024
70008
Argentina
ARG
true
2
1
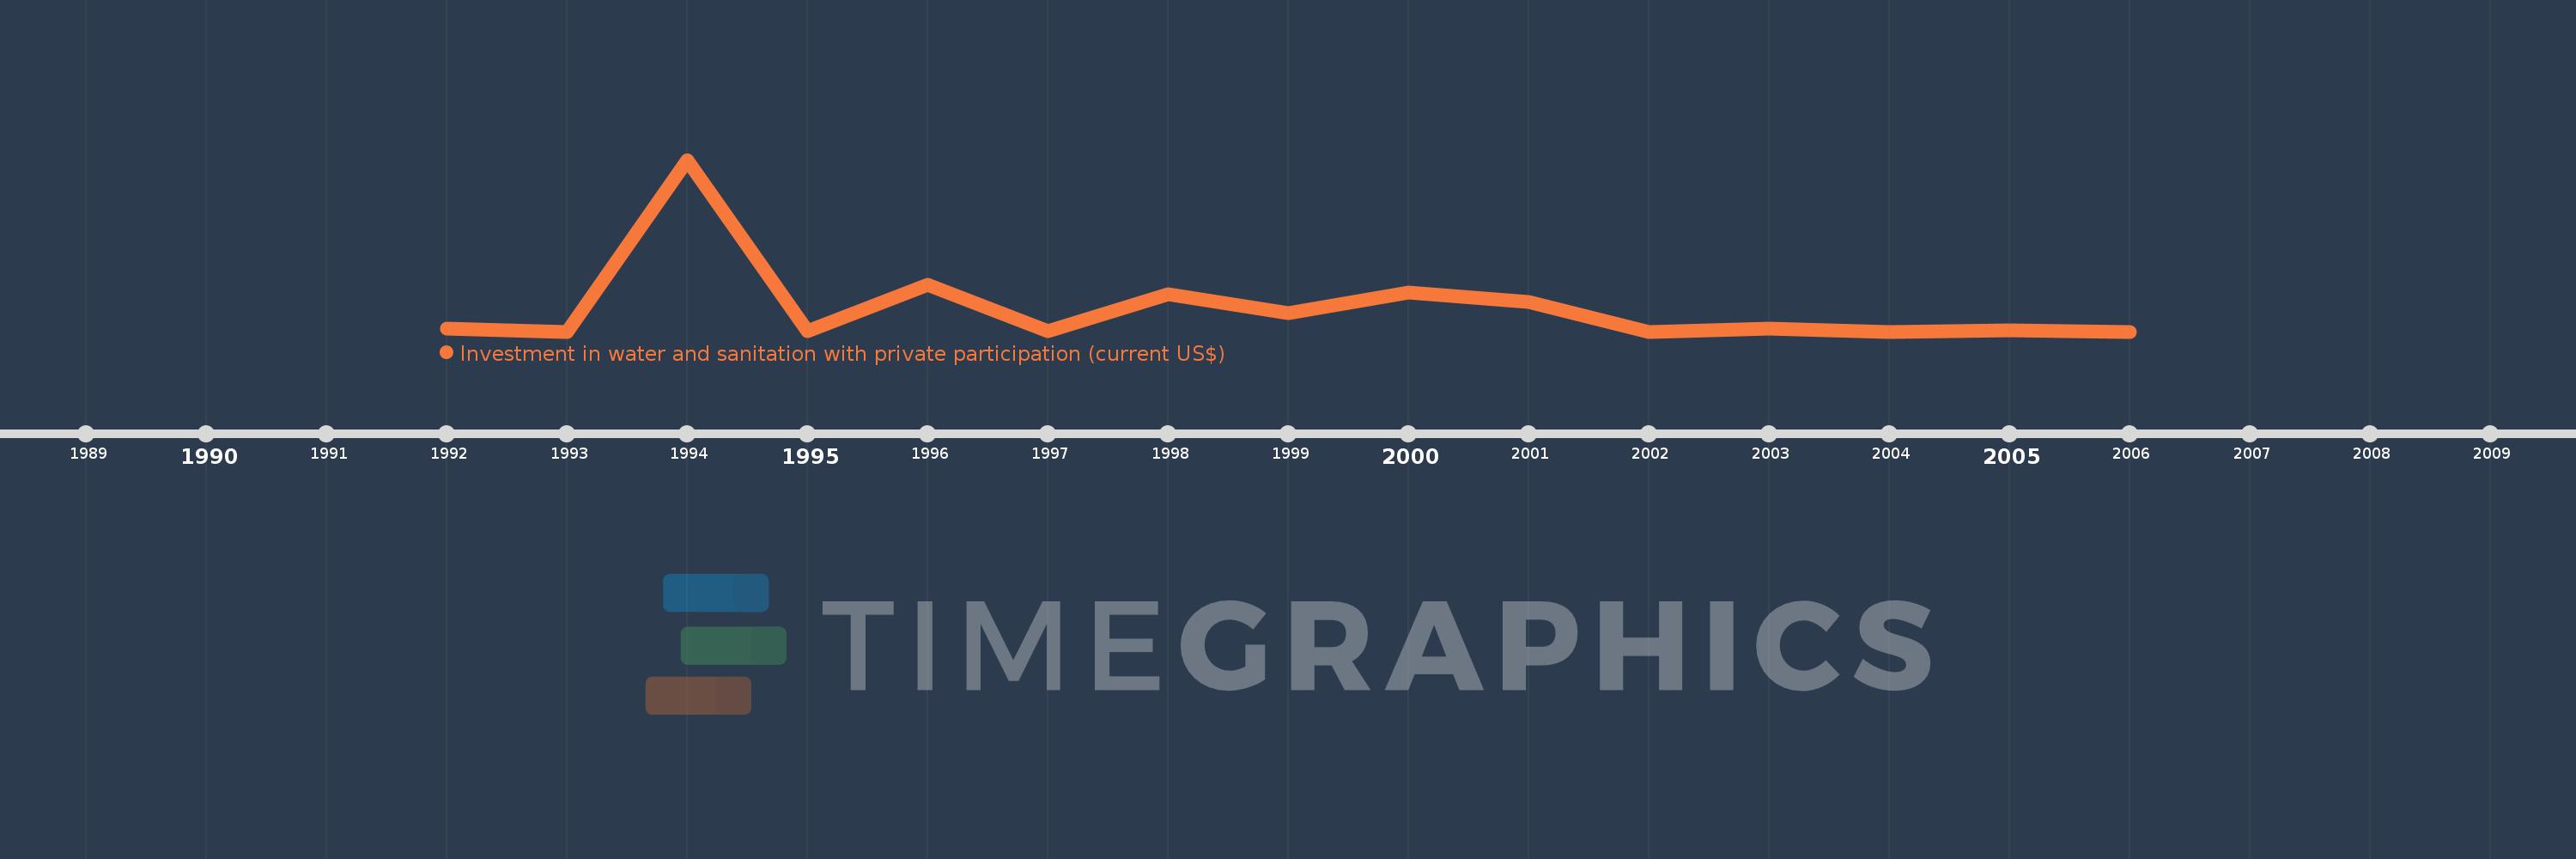
Investment in water and sanitation with private participation (current US$)
2006,2005,2004,2003,2002,2001,2000,1999,1998,1997,1996,1995,1994,1993,1992
This statistics in other country:
Timeline:
This timeline shows a graph from 1992 to 2006 of Argentina. No data until 1991. Number of actual observations by date: 15.
Source name:
World Development Indicators
Source organization:
World Bank, Private Participation in Infrastructure Project Database (http://ppi.worldbank.org).
Categories, topics:
Infrastructure, Private Sector
Last updated:
apr 23, 2017
Indicators value changes by year
Maximum:
4.0 bln
jan 1, 1994
At the date of observation
Value
Absolute change
Change from previous value
jan 1, 1992
75.0 mln
+75.0 mln
0.0%
jan 1, 1993
0.0
-75.0 mln
-100.0%
jan 1, 1994
4.0 bln
+4.0 bln
%
jan 1, 1995
1.9 mln
-3.998 bln
-99.95%
jan 1, 1996
1.091 bln
+1.089 bln
57.32K%
jan 1, 1997
900.0K
-1.09 bln
-99.92%
jan 1, 1998
874.0 mln
+873.1 mln
97.01K%
jan 1, 1999
438.8 mln
-435.2 mln
-49.79%
jan 1, 2000
902.4 mln
+463.6 mln
105.65%
jan 1, 2001
689.9 mln
-212.5 mln
-23.55%
jan 1, 2002
0.0
-689.9 mln
-100.0%
jan 1, 2003
67.0 mln
+67.0 mln
%
jan 1, 2004
0.0
-67.0 mln
-100.0%
jan 1, 2005
34.65 mln
+34.65 mln
%
jan 1, 2006
0.0
-34.65 mln
-100.0%
Ranking of countries by current statistics by years


Comments: