30
/
AIzaSyAYiBZKx7MnpbEhh9jyipgxe19OcubqV5w
April 1, 2024
107450
Colombia
COL
true
2
1
Investment in water and sanitation with private participation (current US$)
2014,2007,2006,2005,2004,2003,2002,2001,2000,1999,1998,1997,1996,1995
Public Timelines
FAQ
Menu
Public Timelines
FAQ
Public Timelines
FAQ
For education
For educational institutions
For teachers
For students
Open cabinet
For educational institutions
For teachers
For students
Open cabinet
Create
Close
Create a timeline
Public timelines
Library
FAQ
Download
Global statistics library
→
Colombia
→
Investment in water and sanitation with private participation (current US$)
This statistics in other country:
Albania
Algeria
Argentina
Armenia
Azerbaijan
Belize
Bolivia
Brazil
Bulgaria
Cameroon
Central African Republic
Chile
China
Colombia
Congo, Rep.
Cote d'Ivoire
Cuba
East Asia & Pacific (excluding high income)
East Asia & Pacific (IDA & IBRD countries)
Ecuador
Egypt, Arab Rep.
Georgia
Ghana
Guatemala
Guyana
Haiti
Honduras
IBRD only
IDA & IBRD total
India
Indonesia
Jordan
Kazakhstan
Kenya
Kosovo
Kyrgyz Republic
Late-demographic dividend
Latin America & Caribbean
Latin America & Caribbean (excluding high income)
Latin America & the Caribbean (IDA & IBRD countries)
Lebanon
Low & middle income
Malaysia
Mauritius
Mexico
Middle income
Montenegro
Morocco
Mozambique
Namibia
Nepal
Niger
Panama
Papua New Guinea
Peru
Philippines
Romania
Russian Federation
Senegal
Serbia
South Africa
South Asia
South Asia (IDA & IBRD)
Sudan
Tanzania
Thailand
Tunisia
Turkey
Uganda
Ukraine
Upper middle income
Uruguay
Uzbekistan
Venezuela, RB
Vietnam
West Bank and Gaza
Zambia
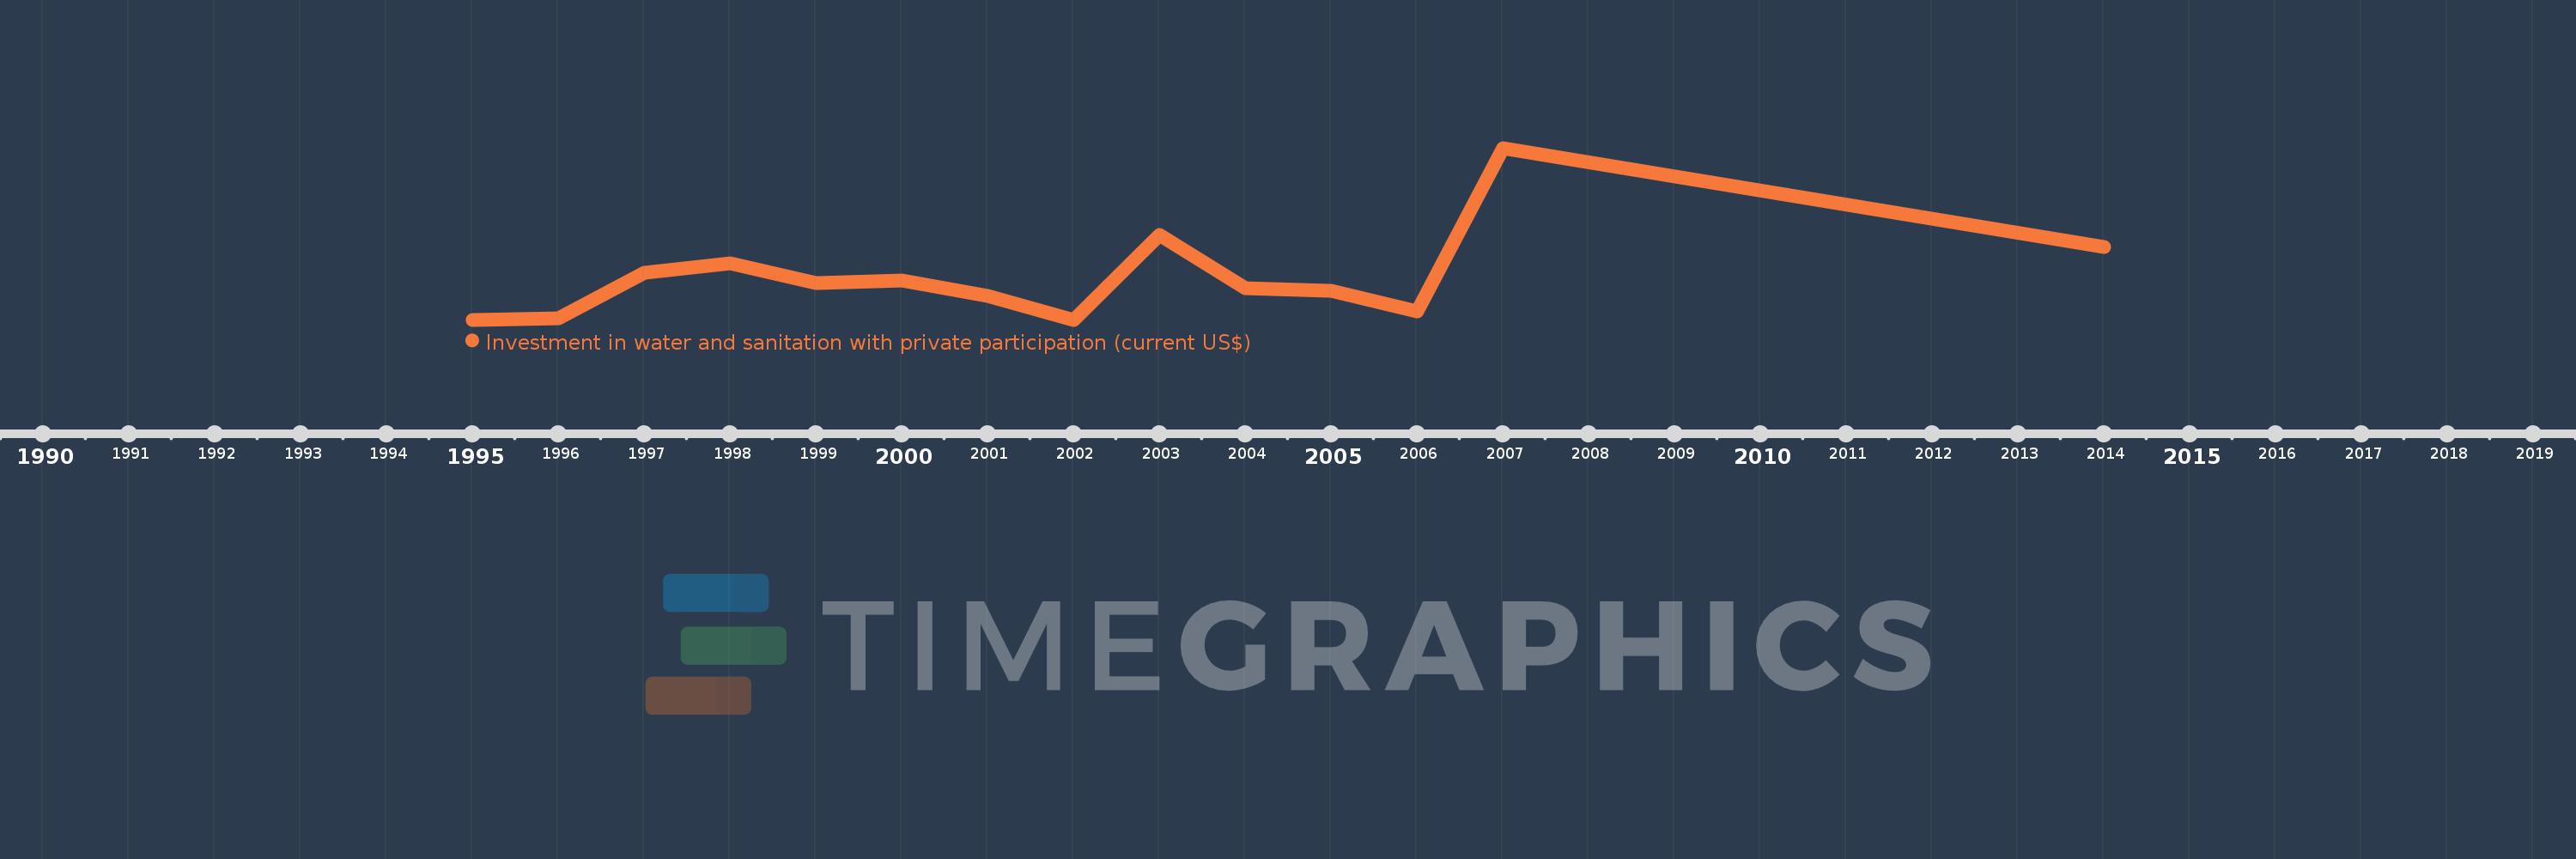
Timeline:
This timeline shows a graph from
1995
to
2014
of Colombia. No data until
1994
. Number of actual observations by date:
14
.
Source name:
World Development Indicators
Source organization:
World Bank, Private Participation in Infrastructure Project Database (http://ppi.worldbank.org).
Categories, topics:
Infrastructure, Private Sector
Last updated:
apr 23, 2017
Indicators value changes by year
Meaning:
76.377 mln
Minimum:
0.0
jan 1, 1995
Maximum:
305.0 mln
jan 1, 2007
At the date of observation
Value
Absolute change
Change from the previous value
jan 1, 1995
0.0
0.0
0.0%
jan 1, 1996
3.0 mln
+3.0 mln
%
jan 1, 1997
83.0 mln
+80.0 mln
2.67K%
jan 1, 1998
100.0 mln
+17.0 mln
20.48%
jan 1, 1999
65.0 mln
-35.0 mln
-35.0%
jan 1, 2000
70.0 mln
+5.0 mln
7.69%
jan 1, 2001
42.0 mln
-28.0 mln
-40.0%
jan 1, 2002
0.0
-42.0 mln
-100.0%
jan 1, 2003
150.7 mln
+150.7 mln
%
jan 1, 2004
55.3 mln
-95.4 mln
-63.3%
jan 1, 2005
51.0 mln
-4.3 mln
-7.78%
jan 1, 2006
15.28 mln
-35.72 mln
-70.04%
jan 1, 2007
305.0 mln
+289.72 mln
1.9K%
jan 1, 2014
129.0 mln
-176.0 mln
-57.7%
Ranking of countries by current statistics by years
About & Feedback
Terms
Privacy
Library
2024
©
Time.Graphics
Support 24/7
Cabinet
Get premium
Donate
The service accepts bank transfer (ACH, Wire) or cards (Visa, MasterCard, etc). Processed by Stripe.
Secured with SSL
Excellent (Trustpilot Reviews)
Based on 115+ reviews
Write your own review on
Trustpilot.com
