29
/
en
AIzaSyAYiBZKx7MnpbEhh9jyipgxe19OcubqV5w
April 1, 2024
229950
Russian Federation
RUS
true
2
1
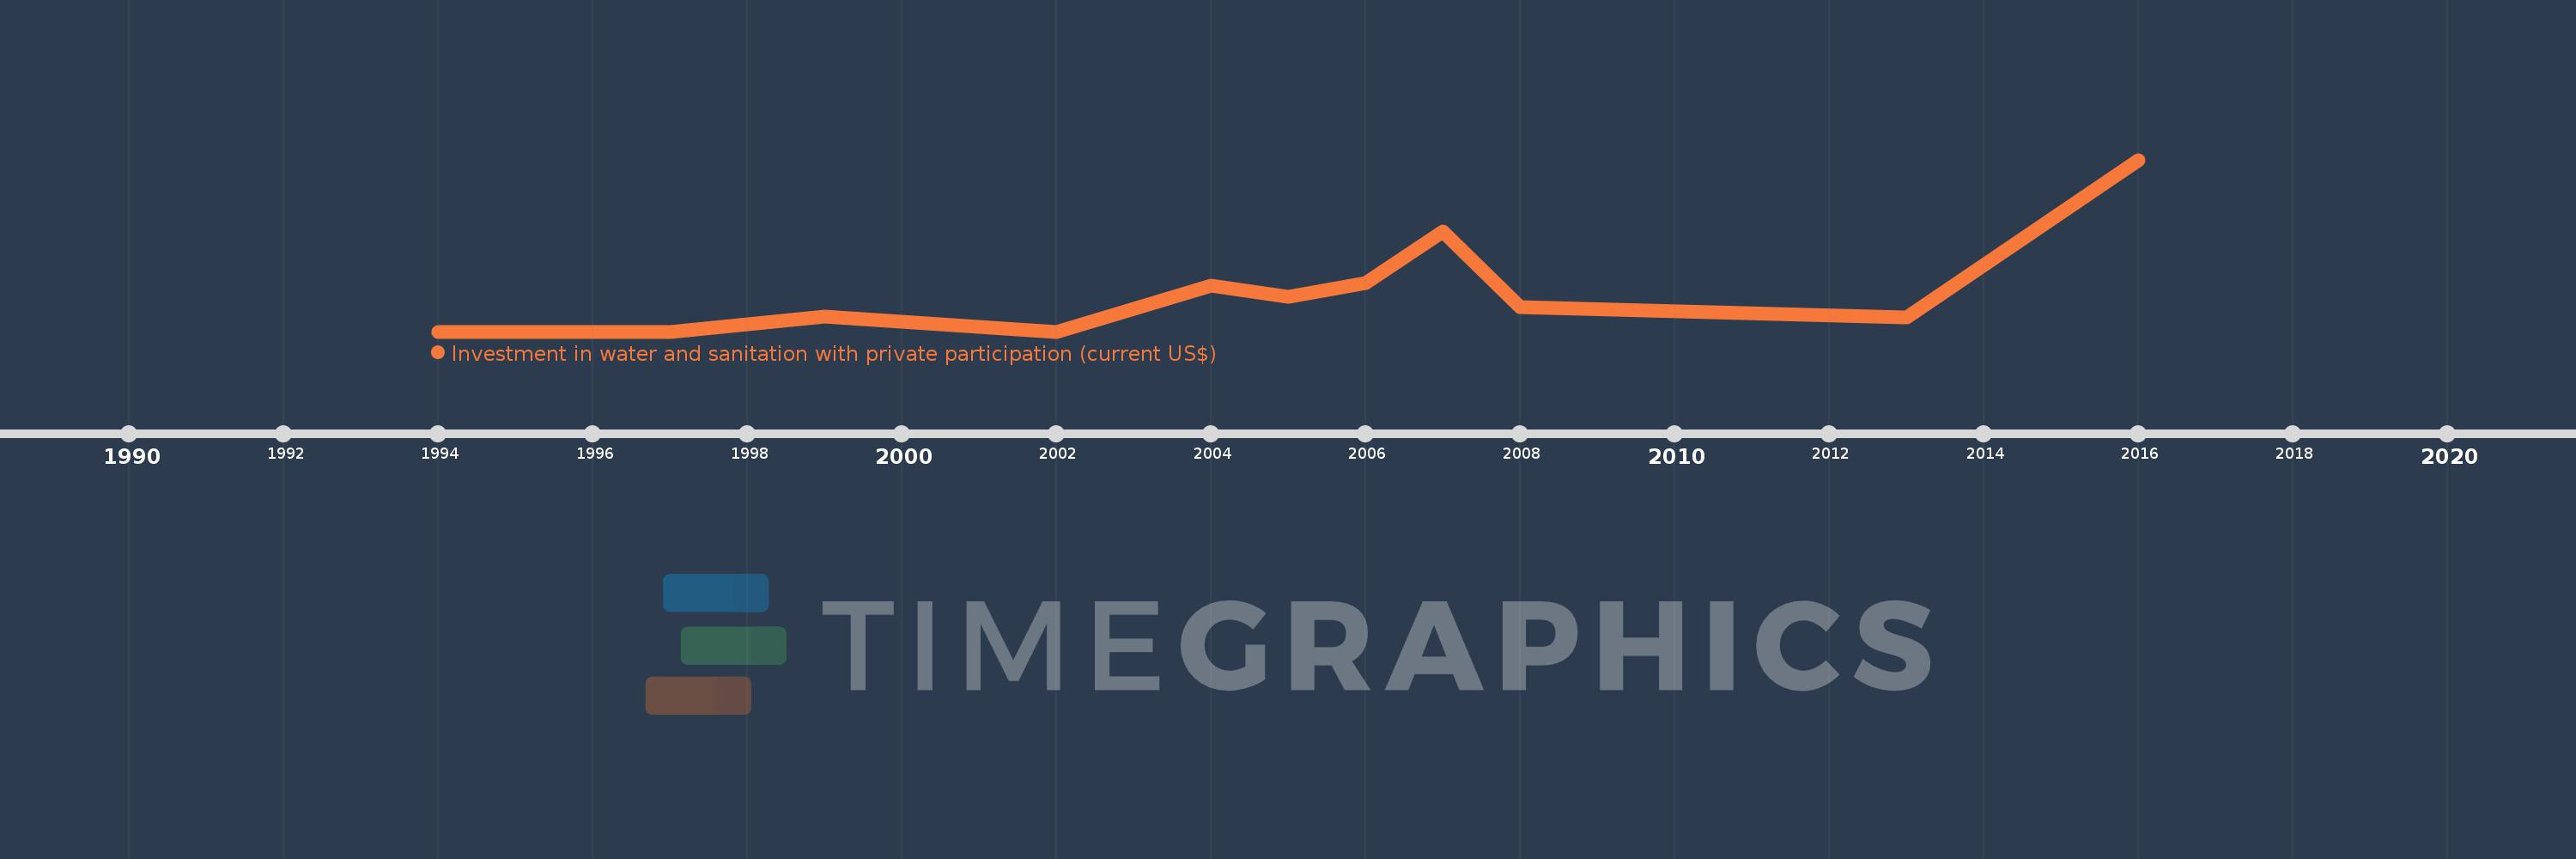
Investment in water and sanitation with private participation (current US$)
2016,2013,2008,2007,2006,2005,2004,2002,1999,1997,1996,1994
This statistics in other country:
Timeline:
This timeline shows a graph from 1994 to 2016 of Russian Federation. No data until 1993. Number of actual observations by date: 12.
Source name:
World Development Indicators
Source organization:
World Bank, Private Participation in Infrastructure Project Database (http://ppi.worldbank.org).
Categories, topics:
Infrastructure, Private Sector
Last updated:
apr 23, 2017
Indicators value changes by year
Maximum:
1.2 bln
jan 1, 2016
At the date of observation
Value
Absolute change
Change from previous value
jan 1, 1999
108.0 mln
+108.0 mln
%
jan 1, 2002
0.0
-108.0 mln
-100.0%
jan 1, 2004
323.6 mln
+323.6 mln
%
jan 1, 2005
240.78 mln
-82.82 mln
-25.59%
jan 1, 2006
340.3 mln
+99.52 mln
41.33%
jan 1, 2007
698.7 mln
+358.4 mln
105.32%
jan 1, 2008
174.0 mln
-524.7 mln
-75.1%
jan 1, 2013
100.0 mln
-74.0 mln
-42.53%
jan 1, 2016
1.2 bln
+1.1 bln
1.1K%
Ranking of countries by current statistics by years


Comments: