29
/
en
AIzaSyAYiBZKx7MnpbEhh9jyipgxe19OcubqV5w
April 1, 2024
245790
South Africa
ZAF
true
2
1
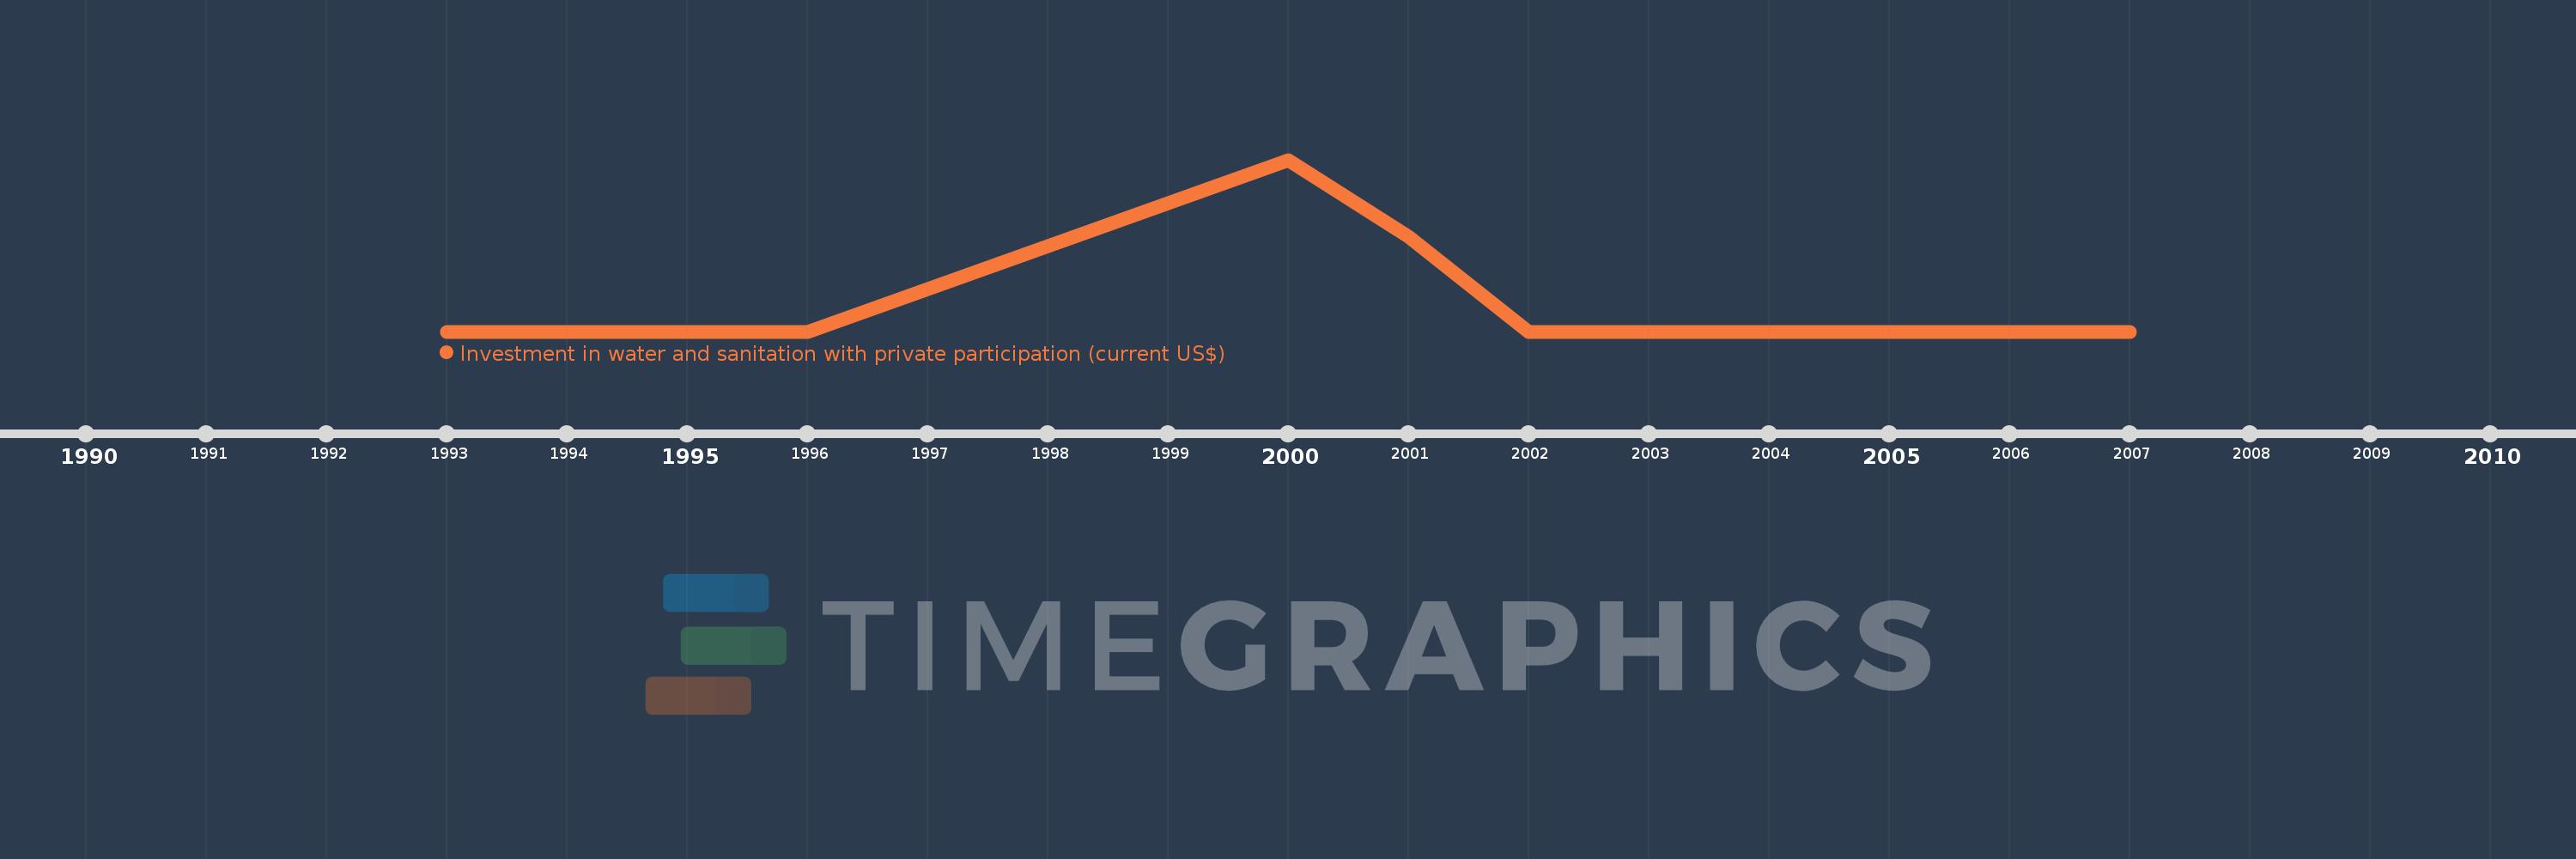
Investment in water and sanitation with private participation (current US$)
2007,2002,2001,2000,1996,1995,1994,1993
This statistics in other country:
Timeline:
This timeline shows a graph from 1993 to 2007 of South Africa. No data until 1992. Number of actual observations by date: 8.
Source name:
World Development Indicators
Source organization:
World Bank, Private Participation in Infrastructure Project Database (http://ppi.worldbank.org).
Categories, topics:
Infrastructure, Private Sector
Last updated:
apr 23, 2017
Indicators value changes by year
Maximum:
56.9 mln
jan 1, 2000
At the date of observation
Value
Absolute change
Change from previous value
jan 1, 2000
56.9 mln
+56.9 mln
%
jan 1, 2001
31.3 mln
-25.6 mln
-44.99%
jan 1, 2002
0.0
-31.3 mln
-100.0%
Ranking of countries by current statistics by years


Comments: