29
/
en
AIzaSyAYiBZKx7MnpbEhh9jyipgxe19OcubqV5w
April 1, 2024
42539
Latin America & Caribbean (excluding high income)
LAC
false
2
1
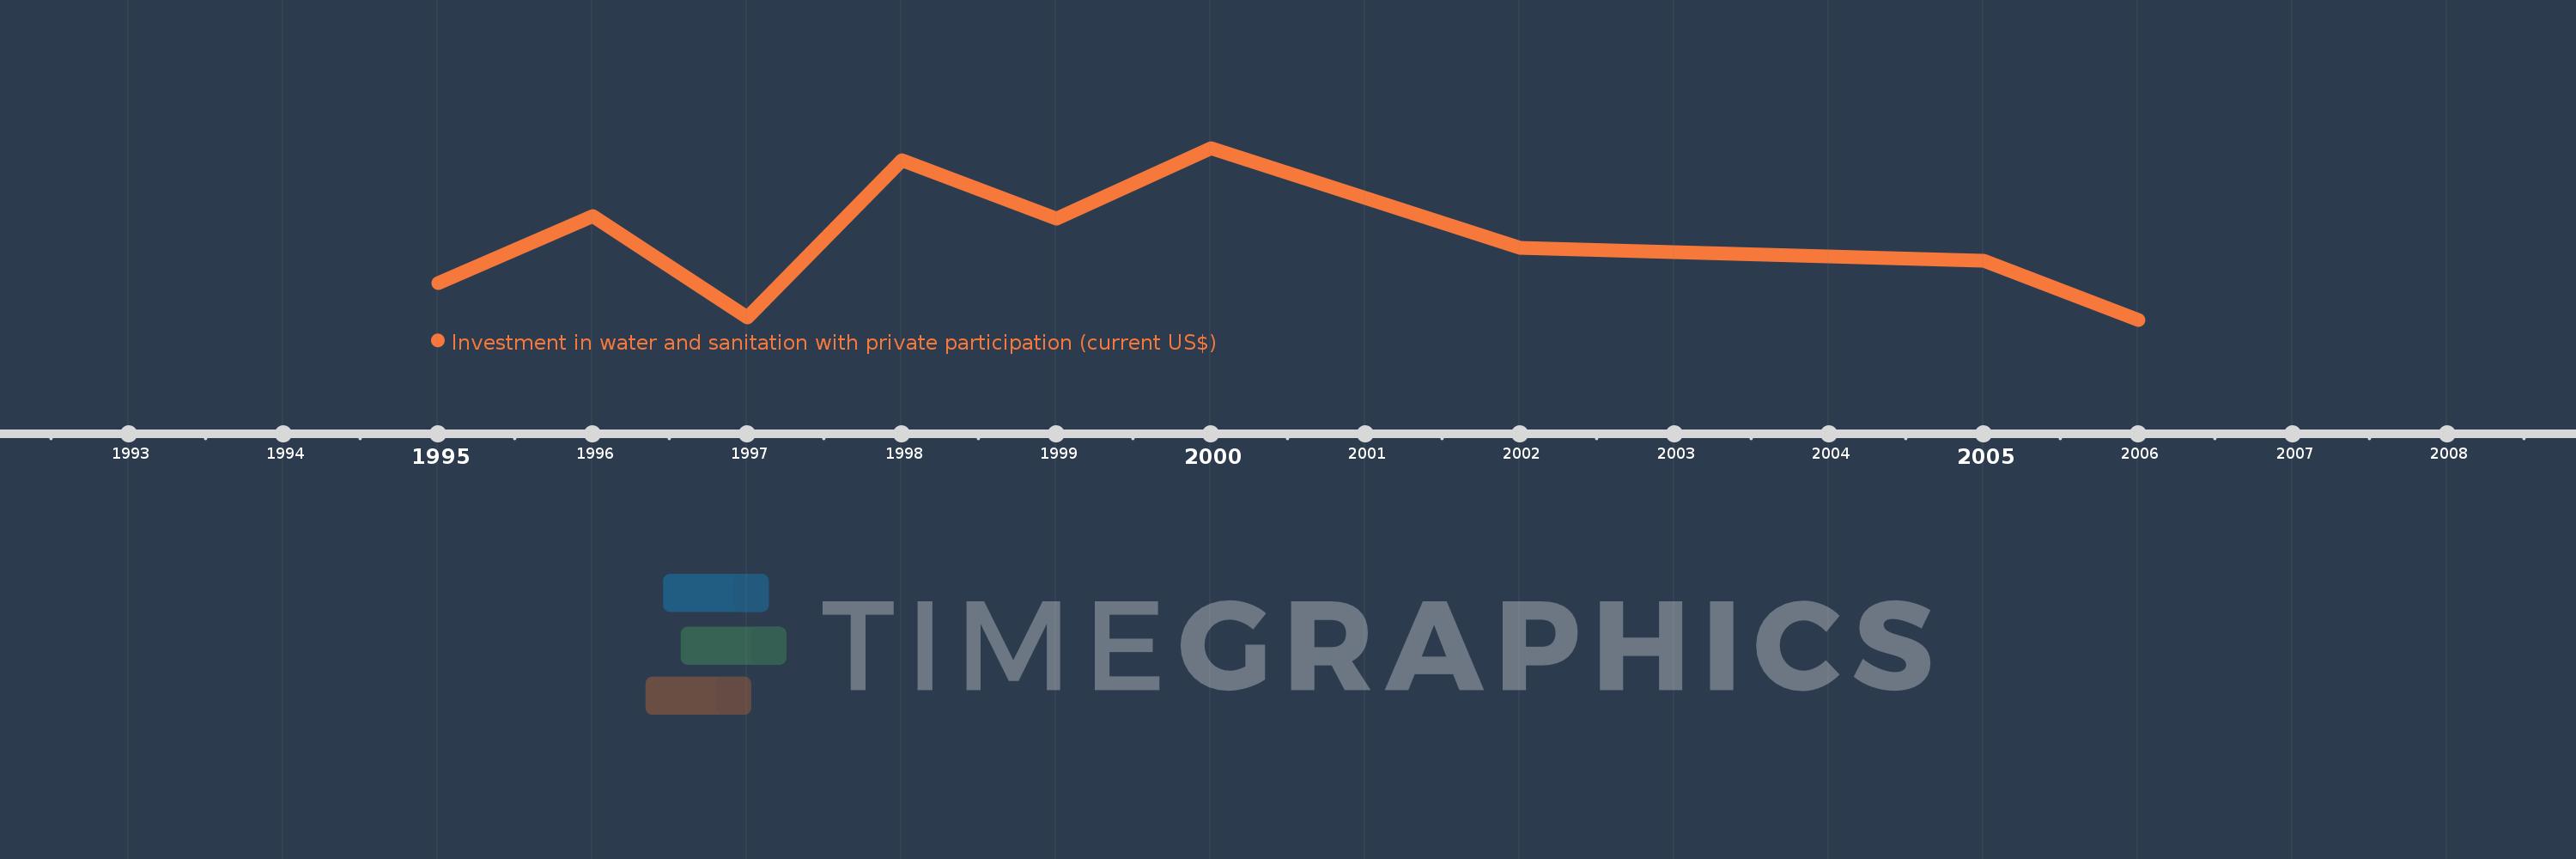
Investment in water and sanitation with private participation (current US$)
2006,2005,2002,2000,1999,1998,1997,1996,1995
This statistics in other country:
Timeline:
This timeline shows a graph from 1995 to 2006 of Latin America & Caribbean (excluding high income). No data until 1994. Number of actual observations by date: 9.
Source name:
World Development Indicators
Source organization:
World Bank, Private Participation in Infrastructure Project Database (http://ppi.worldbank.org).
Categories, topics:
Infrastructure, Private Sector
Last updated:
apr 23, 2017
Indicators value changes by year
Minimum:
120.444 mln
jan 1, 2006
Maximum:
2.007 bln
jan 1, 2000
At the date of observation
Value
Absolute change
Change from previous value
jan 1, 1995
525.2 mln
+525.2 mln
0.0%
jan 1, 1996
1.264 bln
+738.6 mln
140.63%
jan 1, 1997
147.9 mln
-1.116 bln
-88.3%
jan 1, 1998
1.869 bln
+1.721 bln
1.16K%
jan 1, 1999
1.227 bln
-642.3 mln
-34.36%
jan 1, 2000
2.007 bln
+780.4 mln
63.61%
jan 1, 2002
906.43 mln
-1.101 bln
-54.84%
jan 1, 2005
772.68 mln
-133.75 mln
-14.76%
jan 1, 2006
120.444 mln
-652.236 mln
-84.41%
Ranking of countries by current statistics by years


Comments: