29
/
en
AIzaSyAYiBZKx7MnpbEhh9jyipgxe19OcubqV5w
April 1, 2024
67450
Angola
AGO
true
2
1
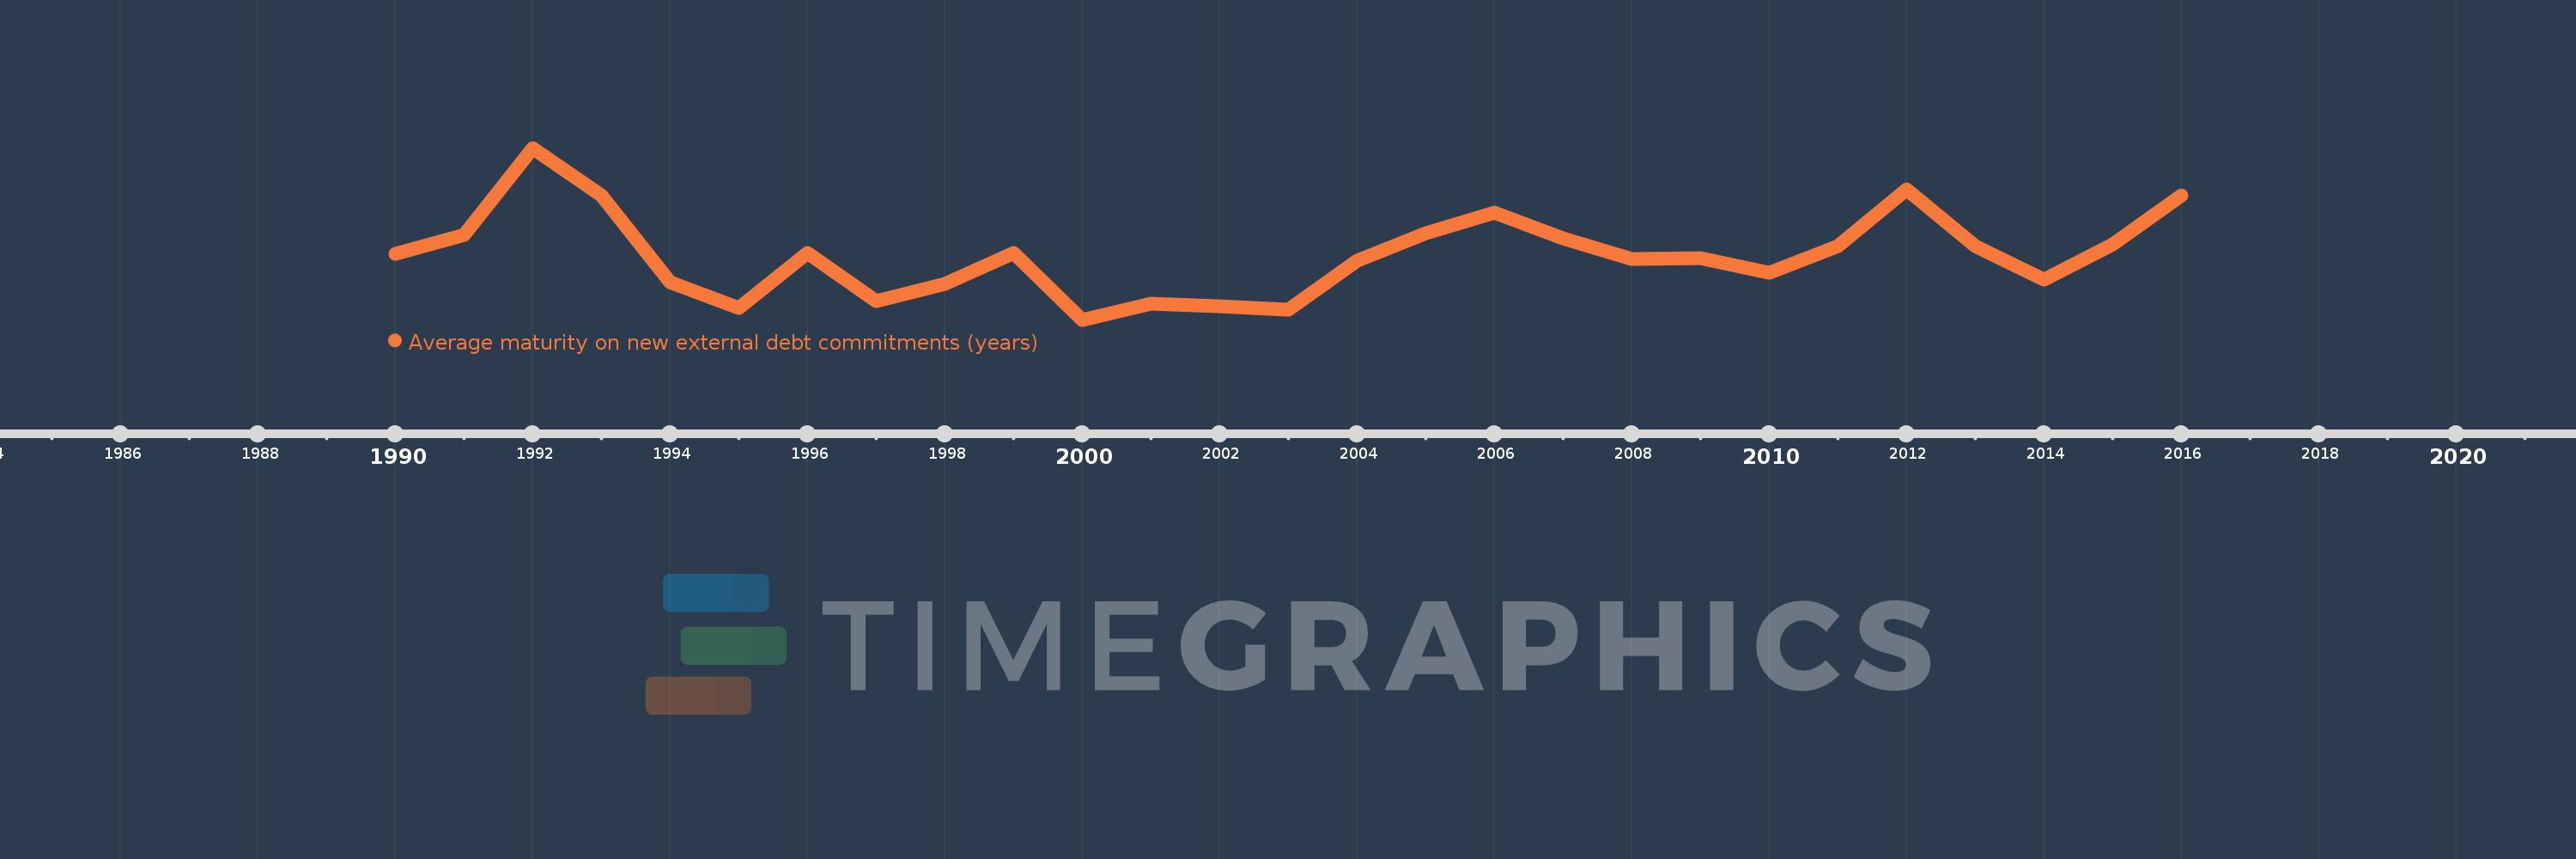
Average maturity on new external debt commitments (years)
2016,2015,2014,2013,2012,2011,2010,2009,2008,2007,2006,2005,2004,2003,2002,2001,2000,1999,1998,1997,1996,1995,1994,1993,1992,1991,1990
This statistics in other country:
Timeline:
This timeline shows a graph from 1990 to 2016 of Angola. No data until 1989. Number of actual observations by date: 27.
Source name:
World Development Indicators
Source organization:
World Bank, International Debt Statistics.
Categories, topics:
External Debt
Last updated:
apr 23, 2017
Indicators value changes by year
Maximum:
17.821
jan 1, 1992
At the date of observation
Value
Absolute change
Change from previous value
jan 1, 1990
8.597
+8.597
0.0%
jan 1, 1991
10.251
+1.654
19.23%
jan 1, 1992
17.821
+7.57
73.85%
jan 1, 1993
13.639
-4.182
-23.46%
jan 1, 1994
6.119
-7.52
-55.14%
jan 1, 1995
3.817
-2.303
-37.63%
jan 1, 1996
8.656
+4.84
126.8%
jan 1, 1997
4.471
-4.185
-48.34%
jan 1, 1998
5.934
+1.462
32.7%
jan 1, 1999
8.63
+2.696
45.43%
jan 1, 2000
2.827
-5.803
-67.24%
jan 1, 2001
4.255
+1.428
50.5%
jan 1, 2002
4.011
-0.244
-5.72%
jan 1, 2003
3.69
-0.321
-8.0%
jan 1, 2004
7.945
+4.255
115.31%
jan 1, 2005
10.375
+2.43
30.58%
jan 1, 2006
12.141
+1.767
17.03%
jan 1, 2007
9.934
-2.207
-18.18%
jan 1, 2008
8.152
-1.782
-17.94%
jan 1, 2009
8.188
+0.036
0.44%
jan 1, 2010
6.911
-1.277
-15.6%
jan 1, 2011
9.219
+2.308
33.4%
jan 1, 2012
14.167
+4.948
53.68%
jan 1, 2013
9.281
-4.886
-34.49%
jan 1, 2014
6.307
-2.974
-32.04%
jan 1, 2015
9.402
+3.095
49.07%
jan 1, 2016
13.658
+4.255
45.26%
Ranking of countries by current statistics by years


Comments: