29
/
en
AIzaSyAYiBZKx7MnpbEhh9jyipgxe19OcubqV5w
April 1, 2024
74634
Azerbaijan
AZE
true
2
1
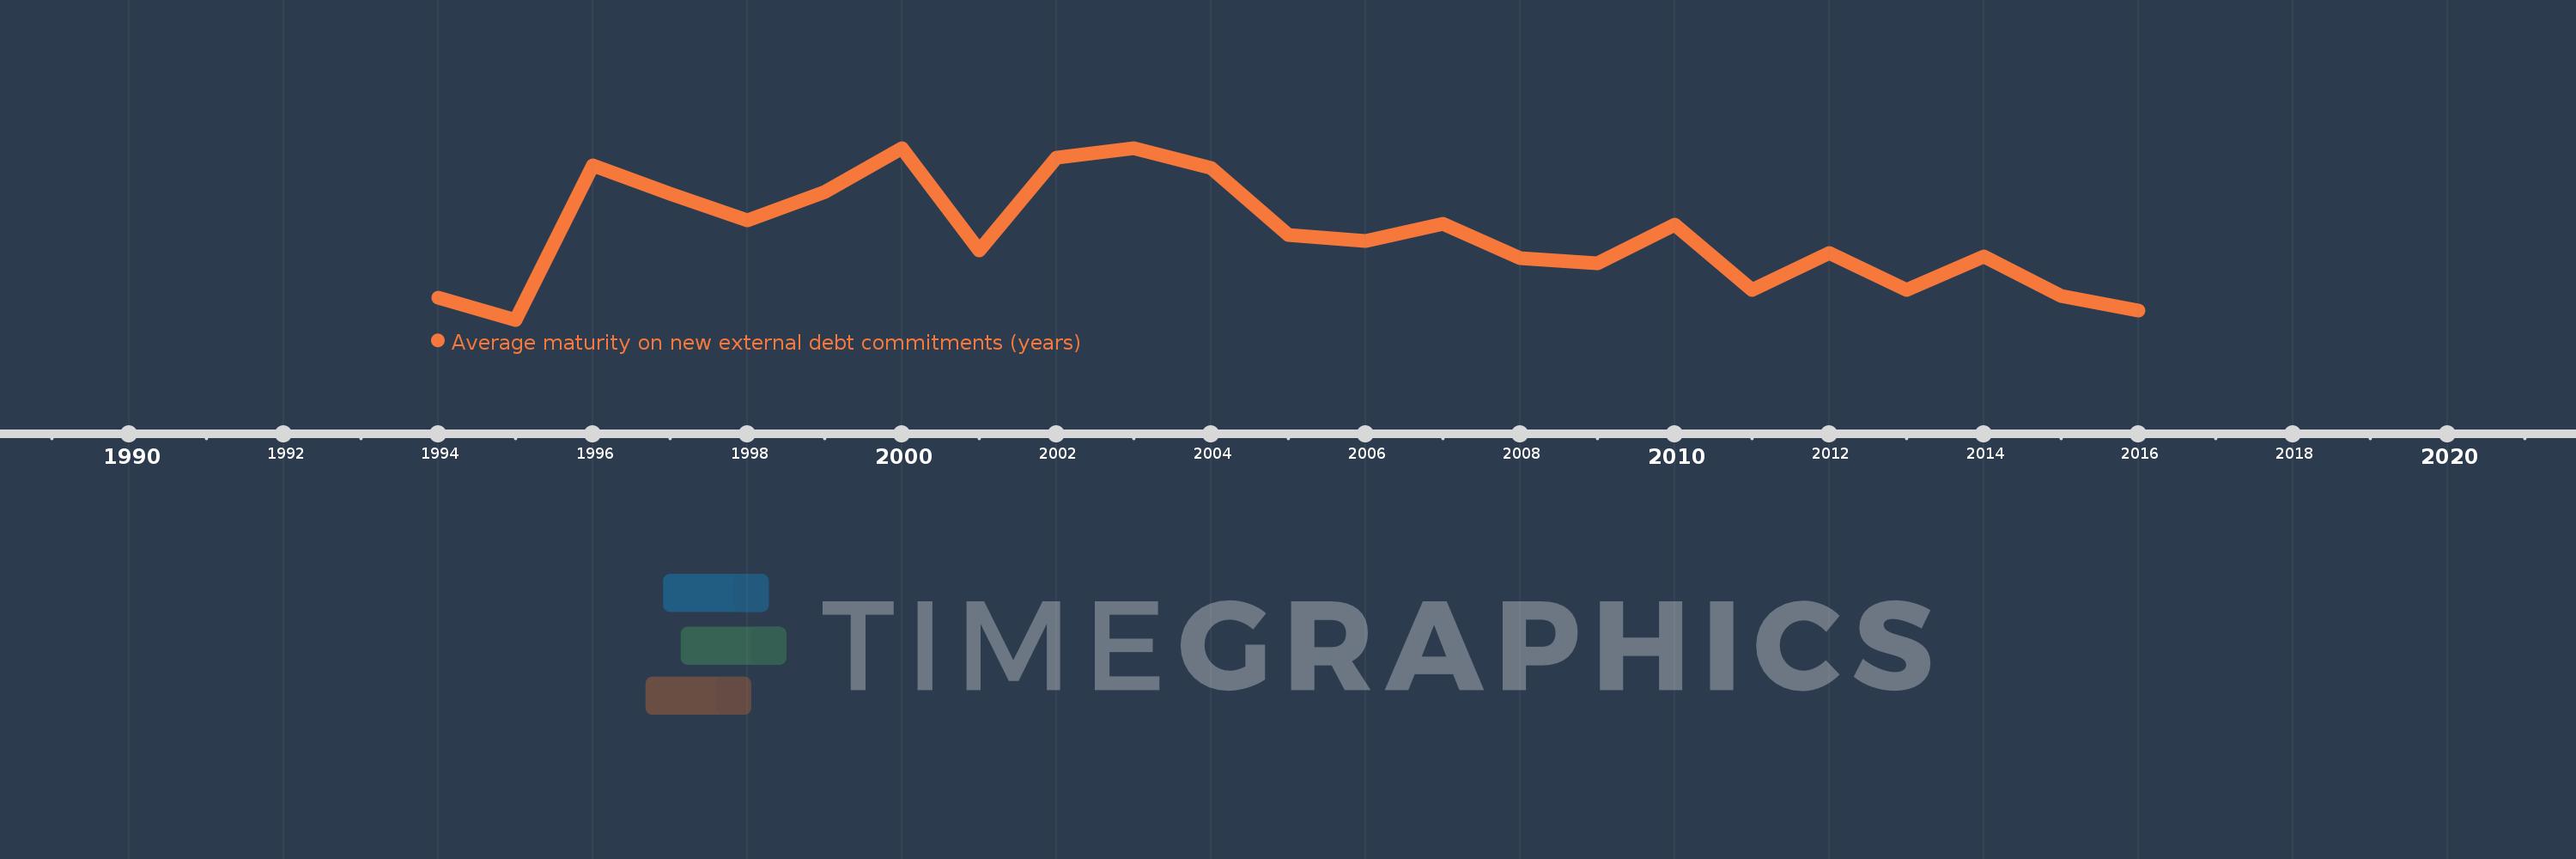
Average maturity on new external debt commitments (years)
2016,2015,2014,2013,2012,2011,2010,2009,2008,2007,2006,2005,2004,2003,2002,2001,2000,1999,1998,1997,1996,1995,1994
This statistics in other country:
Timeline:
This timeline shows a graph from 1994 to 2016 of Azerbaijan. No data until 1993. Number of actual observations by date: 23.
Source name:
World Development Indicators
Source organization:
World Bank, International Debt Statistics.
Categories, topics:
External Debt
Last updated:
apr 23, 2017
Indicators value changes by year
Maximum:
34.754
jan 1, 2003
At the date of observation
Value
Absolute change
Change from previous value
jan 1, 1994
12.667
+12.667
0.0%
jan 1, 1995
9.39
-3.276
-25.87%
jan 1, 1996
32.189
+22.799
242.79%
jan 1, 1997
27.994
-4.195
-13.03%
jan 1, 1998
24.017
-3.977
-14.21%
jan 1, 1999
28.234
+4.217
17.56%
jan 1, 2000
34.666
+6.432
22.78%
jan 1, 2001
19.671
-14.995
-43.26%
jan 1, 2002
33.366
+13.695
69.62%
jan 1, 2003
34.754
+1.388
4.16%
jan 1, 2004
31.787
-2.967
-8.54%
jan 1, 2005
21.96
-9.827
-30.92%
jan 1, 2006
21.034
-0.926
-4.22%
jan 1, 2007
23.618
+2.584
12.28%
jan 1, 2008
18.458
-5.16
-21.85%
jan 1, 2009
17.766
-0.692
-3.75%
jan 1, 2010
23.382
+5.616
31.61%
jan 1, 2011
13.828
-9.554
-40.86%
jan 1, 2012
19.283
+5.455
39.45%
jan 1, 2013
13.768
-5.515
-28.6%
jan 1, 2014
18.745
+4.976
36.14%
jan 1, 2015
12.881
-5.864
-31.28%
jan 1, 2016
10.784
-2.097
-16.28%
Ranking of countries by current statistics by years


Comments: