29
/
en
AIzaSyAYiBZKx7MnpbEhh9jyipgxe19OcubqV5w
April 1, 2024
27886
East Asia & Pacific (excluding high income)
EAP
false
2
1
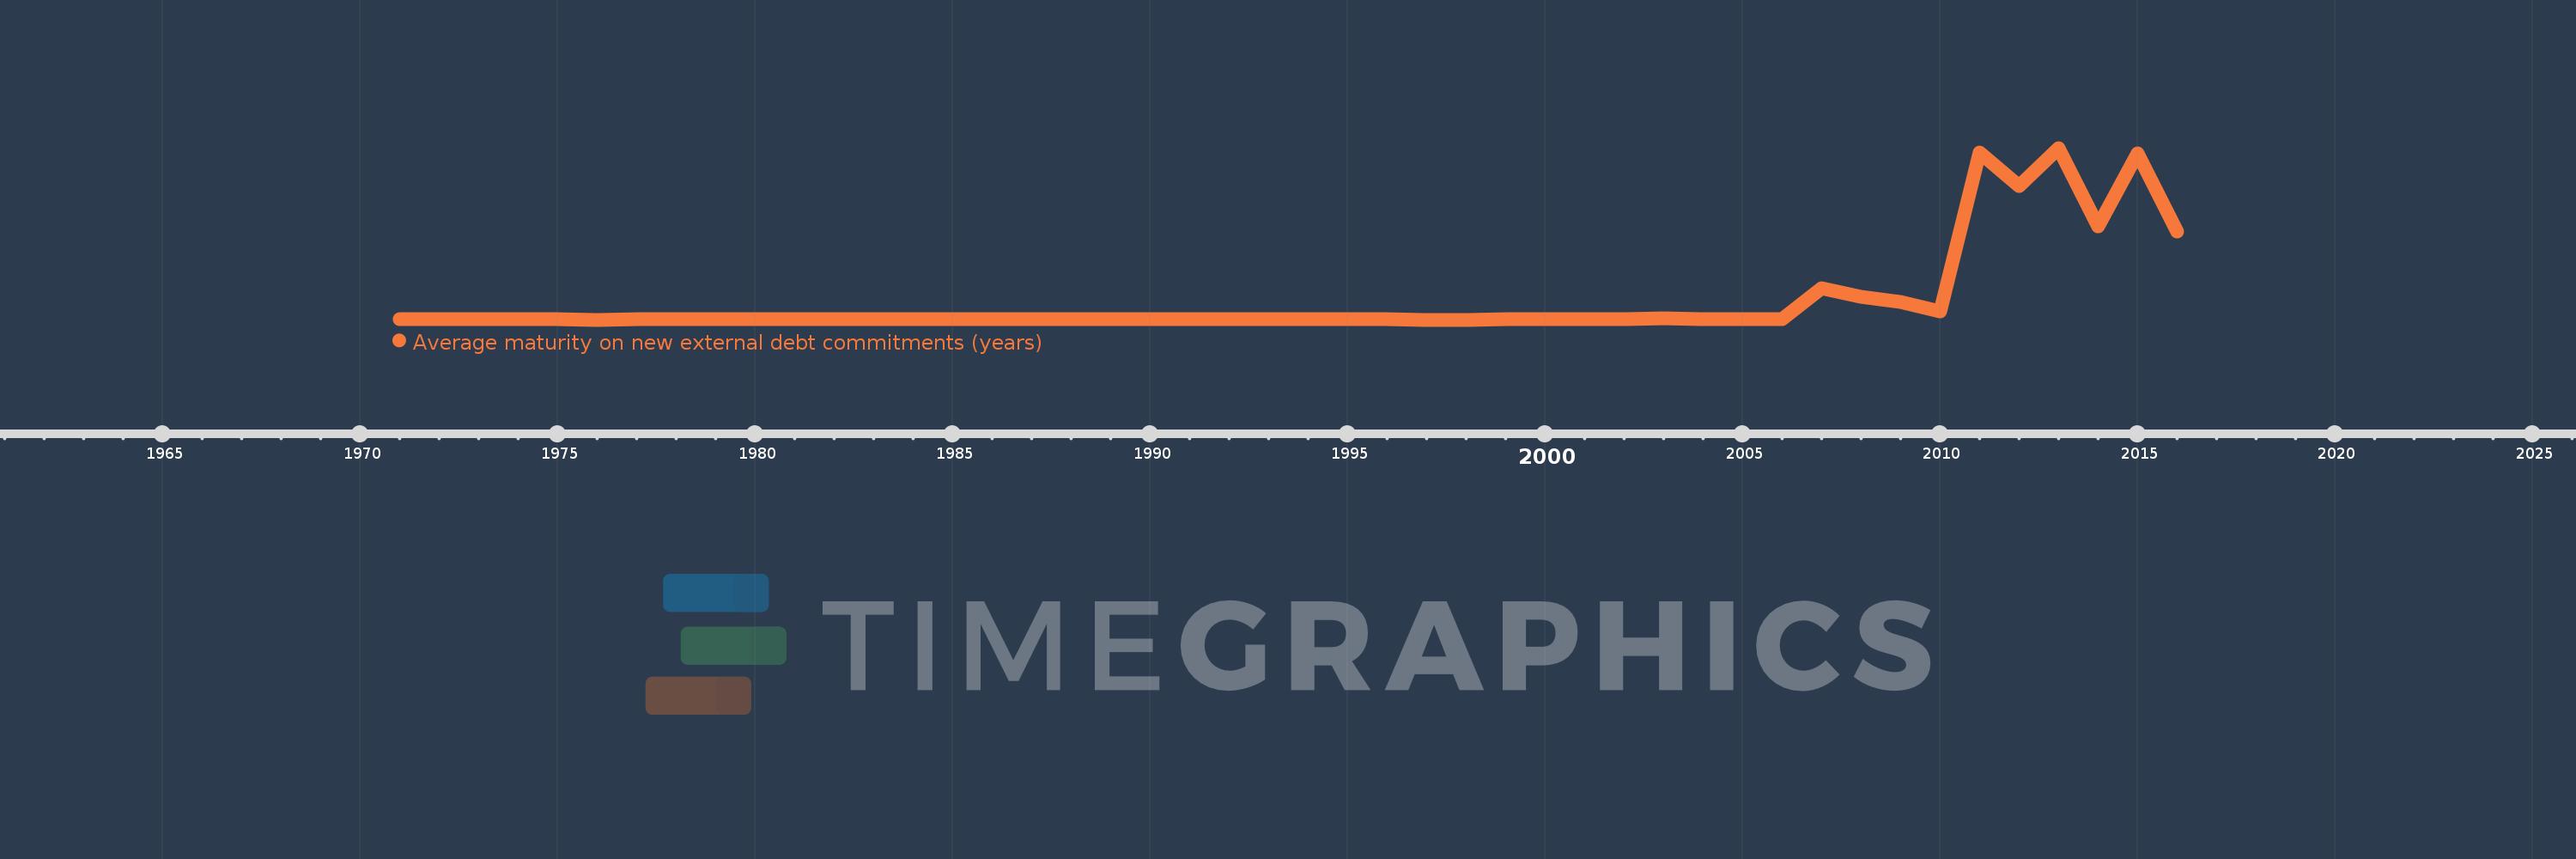
Average maturity on new external debt commitments (years)
2016,2015,2014,2013,2012,2011,2010,2009,2008,2007,2006,2005,2004,2003,2002,2001,2000,1999,1998,1997,1996,1995,1994,1993,1992,1991,1990,1989,1988,1987,1986,1985,1984,1983,1982,1981,1980,1979,1978,1977,1976,1975,1974,1973,1972,1971
This statistics in other country:
Timeline:
This timeline shows a graph from 1971 to 2016 of East Asia & Pacific (excluding high income). No data until 1970. Number of actual observations by date: 46.
Source name:
World Development Indicators
Source organization:
World Bank, International Debt Statistics.
Categories, topics:
External Debt
Last updated:
apr 23, 2017
Indicators value changes by year
Minimum:
13.363
jan 1, 1998
Maximum:
2.315K
jan 1, 2013
At the date of observation
Value
Absolute change
Change from previous value
jan 1, 1971
25.581
+25.581
0.0%
jan 1, 1972
24.131
-1.45
-5.67%
jan 1, 1973
19.991
-4.14
-17.16%
jan 1, 1974
23.594
+3.602
18.02%
jan 1, 1975
19.55
-4.043
-17.14%
jan 1, 1976
14.203
-5.347
-27.35%
jan 1, 1977
16.456
+2.252
15.86%
jan 1, 1978
17.511
+1.055
6.41%
jan 1, 1979
16.507
-1.004
-5.74%
jan 1, 1980
17.111
+0.604
3.66%
jan 1, 1981
16.671
-0.44
-2.57%
jan 1, 1982
15.884
-0.786
-4.72%
jan 1, 1983
16.321
+0.436
2.75%
jan 1, 1984
15.76
-0.561
-3.44%
jan 1, 1985
17.085
+1.325
8.41%
jan 1, 1986
15.863
-1.222
-7.15%
jan 1, 1987
16.156
+0.292
1.84%
jan 1, 1988
17.718
+1.562
9.67%
jan 1, 1989
17.864
+0.146
0.82%
jan 1, 1990
19.095
+1.231
6.89%
jan 1, 1991
19.738
+0.643
3.37%
jan 1, 1992
20.056
+0.318
1.61%
jan 1, 1993
17.727
-2.329
-11.61%
jan 1, 1994
15.991
-1.735
-9.79%
jan 1, 1995
17.696
+1.705
10.66%
jan 1, 1996
15.798
-1.899
-10.73%
jan 1, 1997
14.508
-1.289
-8.16%
jan 1, 1998
13.363
-1.146
-7.9%
jan 1, 1999
18.376
+5.013
37.52%
jan 1, 2000
18.214
-0.162
-0.88%
jan 1, 2001
18.238
+0.024
0.13%
jan 1, 2002
16.644
-1.594
-8.74%
jan 1, 2003
34.905
+18.262
109.72%
jan 1, 2004
17.939
-16.966
-48.61%
jan 1, 2005
16.919
-1.021
-5.69%
jan 1, 2006
17.642
+0.723
4.27%
jan 1, 2007
433.442
+415.8
2.36K%
jan 1, 2008
320.241
-113.2
-26.12%
jan 1, 2009
252.533
-67.708
-21.14%
jan 1, 2010
127.07
-125.463
-49.68%
jan 1, 2011
2.251K
+2.124K
1.67K%
jan 1, 2012
1.809K
-441.379
-19.61%
jan 1, 2013
2.315K
+505.906
27.96%
jan 1, 2014
1.259K
-1.056K
-45.61%
jan 1, 2015
2.245K
+985.862
78.29%
jan 1, 2016
1.193K
-1.052K
-46.85%
Ranking of countries by current statistics by years


Comments: