29
/
en
AIzaSyAYiBZKx7MnpbEhh9jyipgxe19OcubqV5w
April 1, 2024
70791
Armenia
ARM
true
2
1
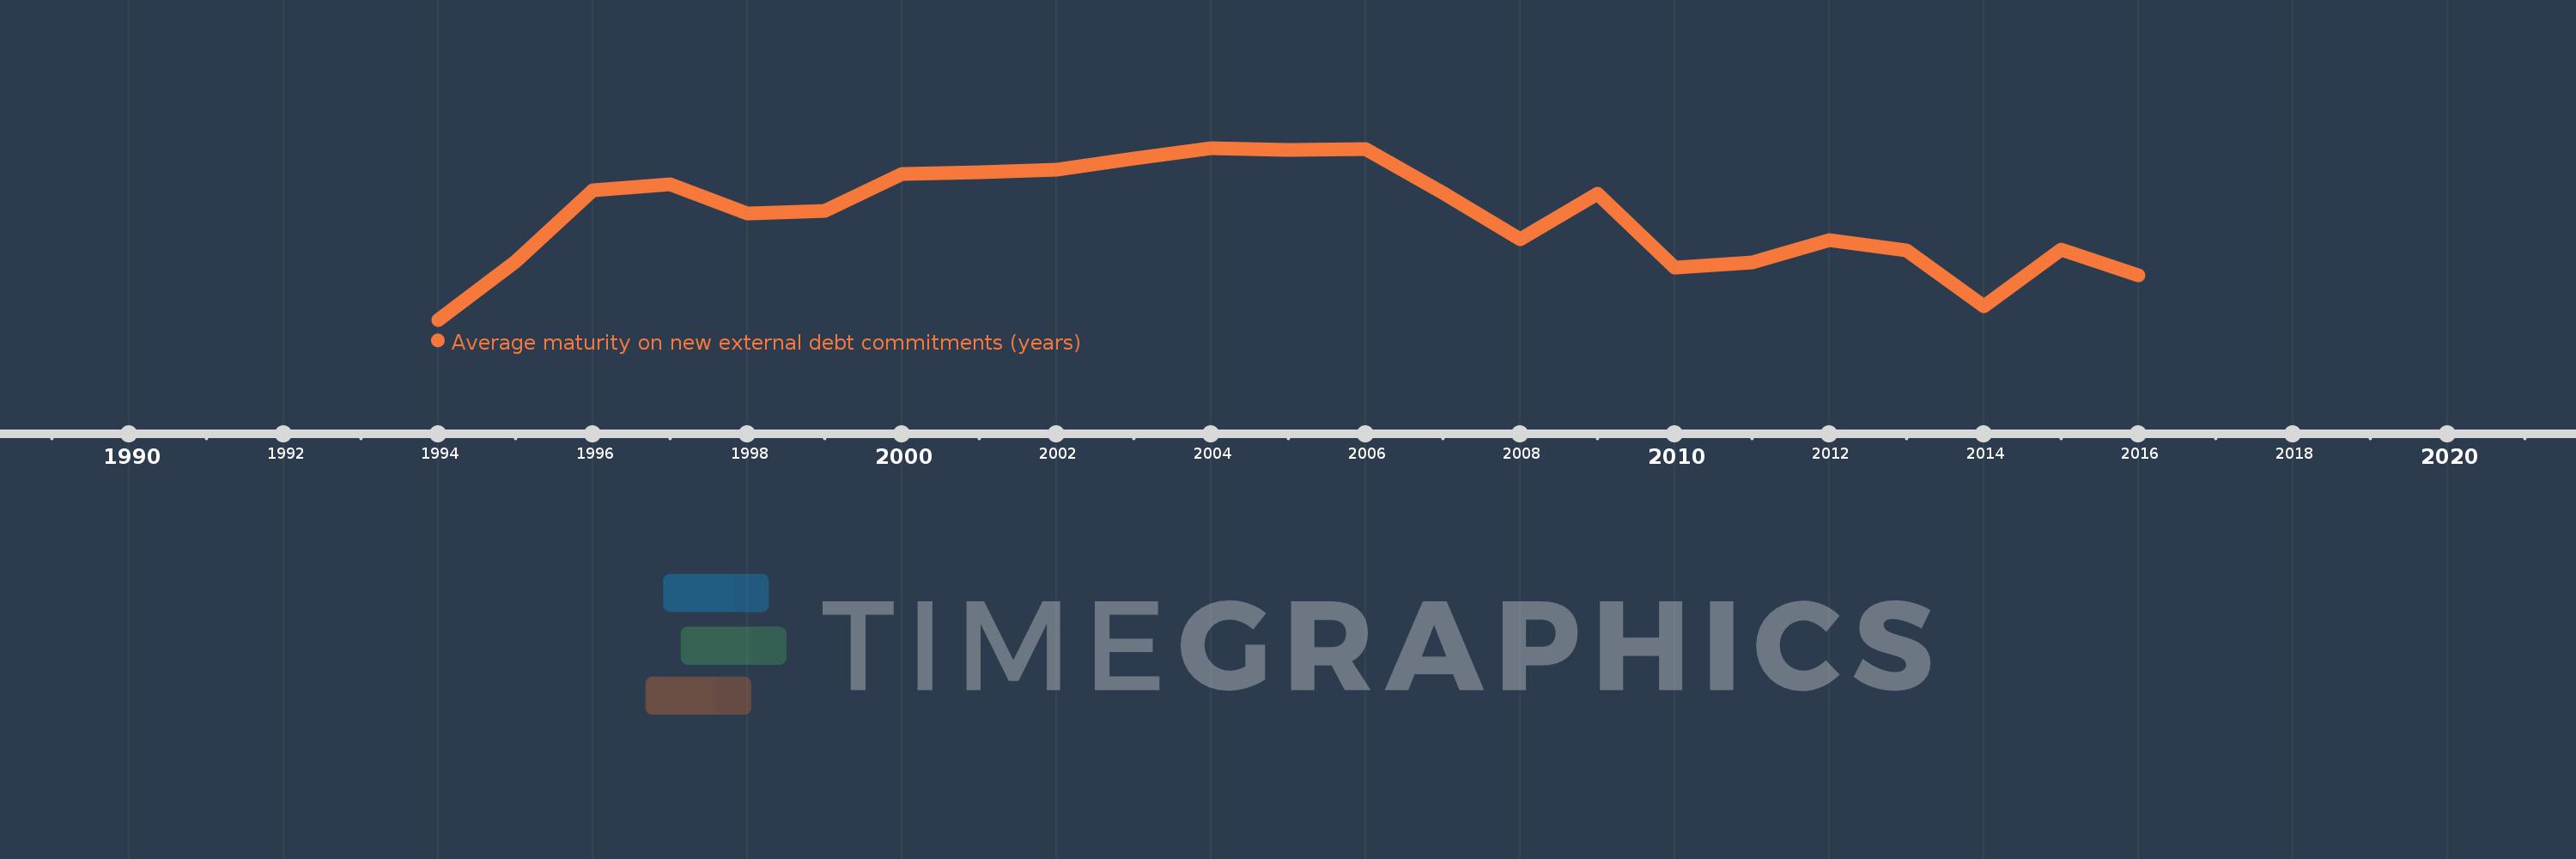
Average maturity on new external debt commitments (years)
2016,2015,2014,2013,2012,2011,2010,2009,2008,2007,2006,2005,2004,2003,2002,2001,2000,1999,1998,1997,1996,1995,1994
This statistics in other country:
Timeline:
This timeline shows a graph from 1994 to 2016 of Armenia. No data until 1993. Number of actual observations by date: 23.
Source name:
World Development Indicators
Source organization:
World Bank, International Debt Statistics.
Categories, topics:
External Debt
Last updated:
apr 23, 2017
Indicators value changes by year
Minimum:
10.883
jan 1, 1994
Maximum:
39.715
jan 1, 2004
At the date of observation
Value
Absolute change
Change from previous value
jan 1, 1994
10.883
+10.883
0.0%
jan 1, 1995
20.661
+9.778
89.84%
jan 1, 1996
32.591
+11.931
57.75%
jan 1, 1997
33.669
+1.078
3.31%
jan 1, 1998
28.664
-5.005
-14.87%
jan 1, 1999
29.146
+0.483
1.68%
jan 1, 2000
35.408
+6.261
21.48%
jan 1, 2001
35.673
+0.266
0.75%
jan 1, 2002
36.028
+0.354
0.99%
jan 1, 2003
37.97
+1.943
5.39%
jan 1, 2004
39.715
+1.744
4.59%
jan 1, 2005
39.353
-0.361
-0.91%
jan 1, 2006
39.557
+0.203
0.52%
jan 1, 2007
32.161
-7.396
-18.7%
jan 1, 2008
24.362
-7.798
-24.25%
jan 1, 2009
32.079
+7.717
31.67%
jan 1, 2010
19.669
-12.41
-38.69%
jan 1, 2011
20.434
+0.765
3.89%
jan 1, 2012
24.26
+3.826
18.72%
jan 1, 2013
22.527
-1.734
-7.15%
jan 1, 2014
13.171
-9.356
-41.53%
jan 1, 2015
22.637
+9.466
71.87%
jan 1, 2016
18.323
-4.314
-19.06%
Ranking of countries by current statistics by years


Comments: