29
/
en
AIzaSyAYiBZKx7MnpbEhh9jyipgxe19OcubqV5w
April 1, 2024
270319
Turkmenistan
TKM
true
2
1
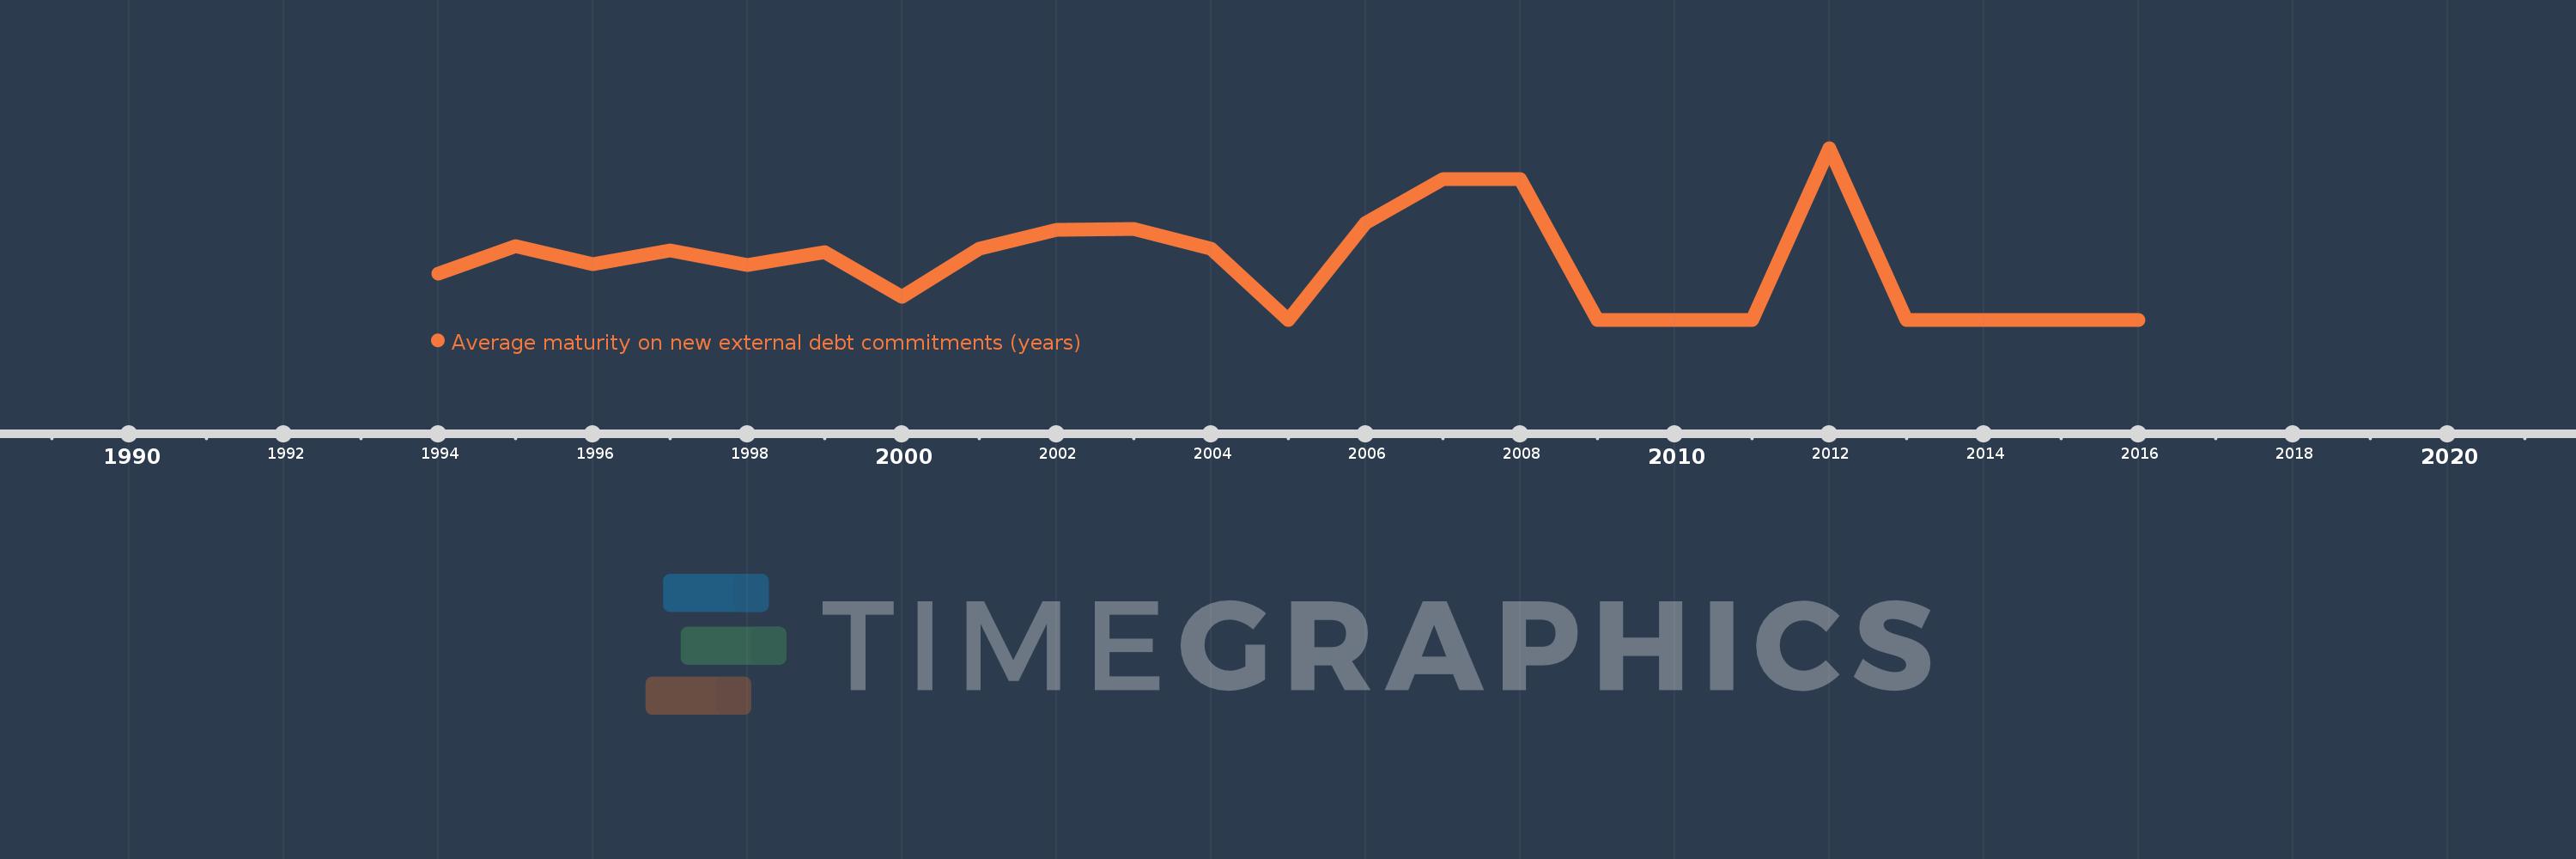
Average maturity on new external debt commitments (years)
2016,2015,2014,2013,2012,2011,2010,2009,2008,2007,2006,2005,2004,2003,2002,2001,2000,1999,1998,1997,1996,1995,1994
This statistics in other country:
Timeline:
This timeline shows a graph from 1994 to 2016 of Turkmenistan. No data until 1993. Number of actual observations by date: 23.
Source name:
World Development Indicators
Source organization:
World Bank, International Debt Statistics.
Categories, topics:
External Debt
Last updated:
apr 23, 2017
Indicators value changes by year
At the date of observation
Value
Absolute change
Change from previous value
jan 1, 1994
6.612
+6.612
0.0%
jan 1, 1995
10.526
+3.914
59.19%
jan 1, 1996
7.953
-2.573
-24.45%
jan 1, 1997
9.92
+1.968
24.74%
jan 1, 1998
7.859
-2.061
-20.78%
jan 1, 1999
9.604
+1.745
22.2%
jan 1, 2000
3.25
-6.354
-66.16%
jan 1, 2001
10.167
+6.917
212.82%
jan 1, 2002
12.876
+2.709
26.65%
jan 1, 2003
12.961
+0.085
0.66%
jan 1, 2004
10.083
-2.878
-22.2%
jan 1, 2005
0.0
-10.083
-100.0%
jan 1, 2006
13.833
+13.833
%
jan 1, 2007
20.083
+6.25
45.18%
jan 1, 2008
20.0
-0.083
-0.41%
jan 1, 2009
0.0
-20.0
-100.0%
jan 1, 2013
0.0
-24.5
-100.0%
Ranking of countries by current statistics by years


Comments: