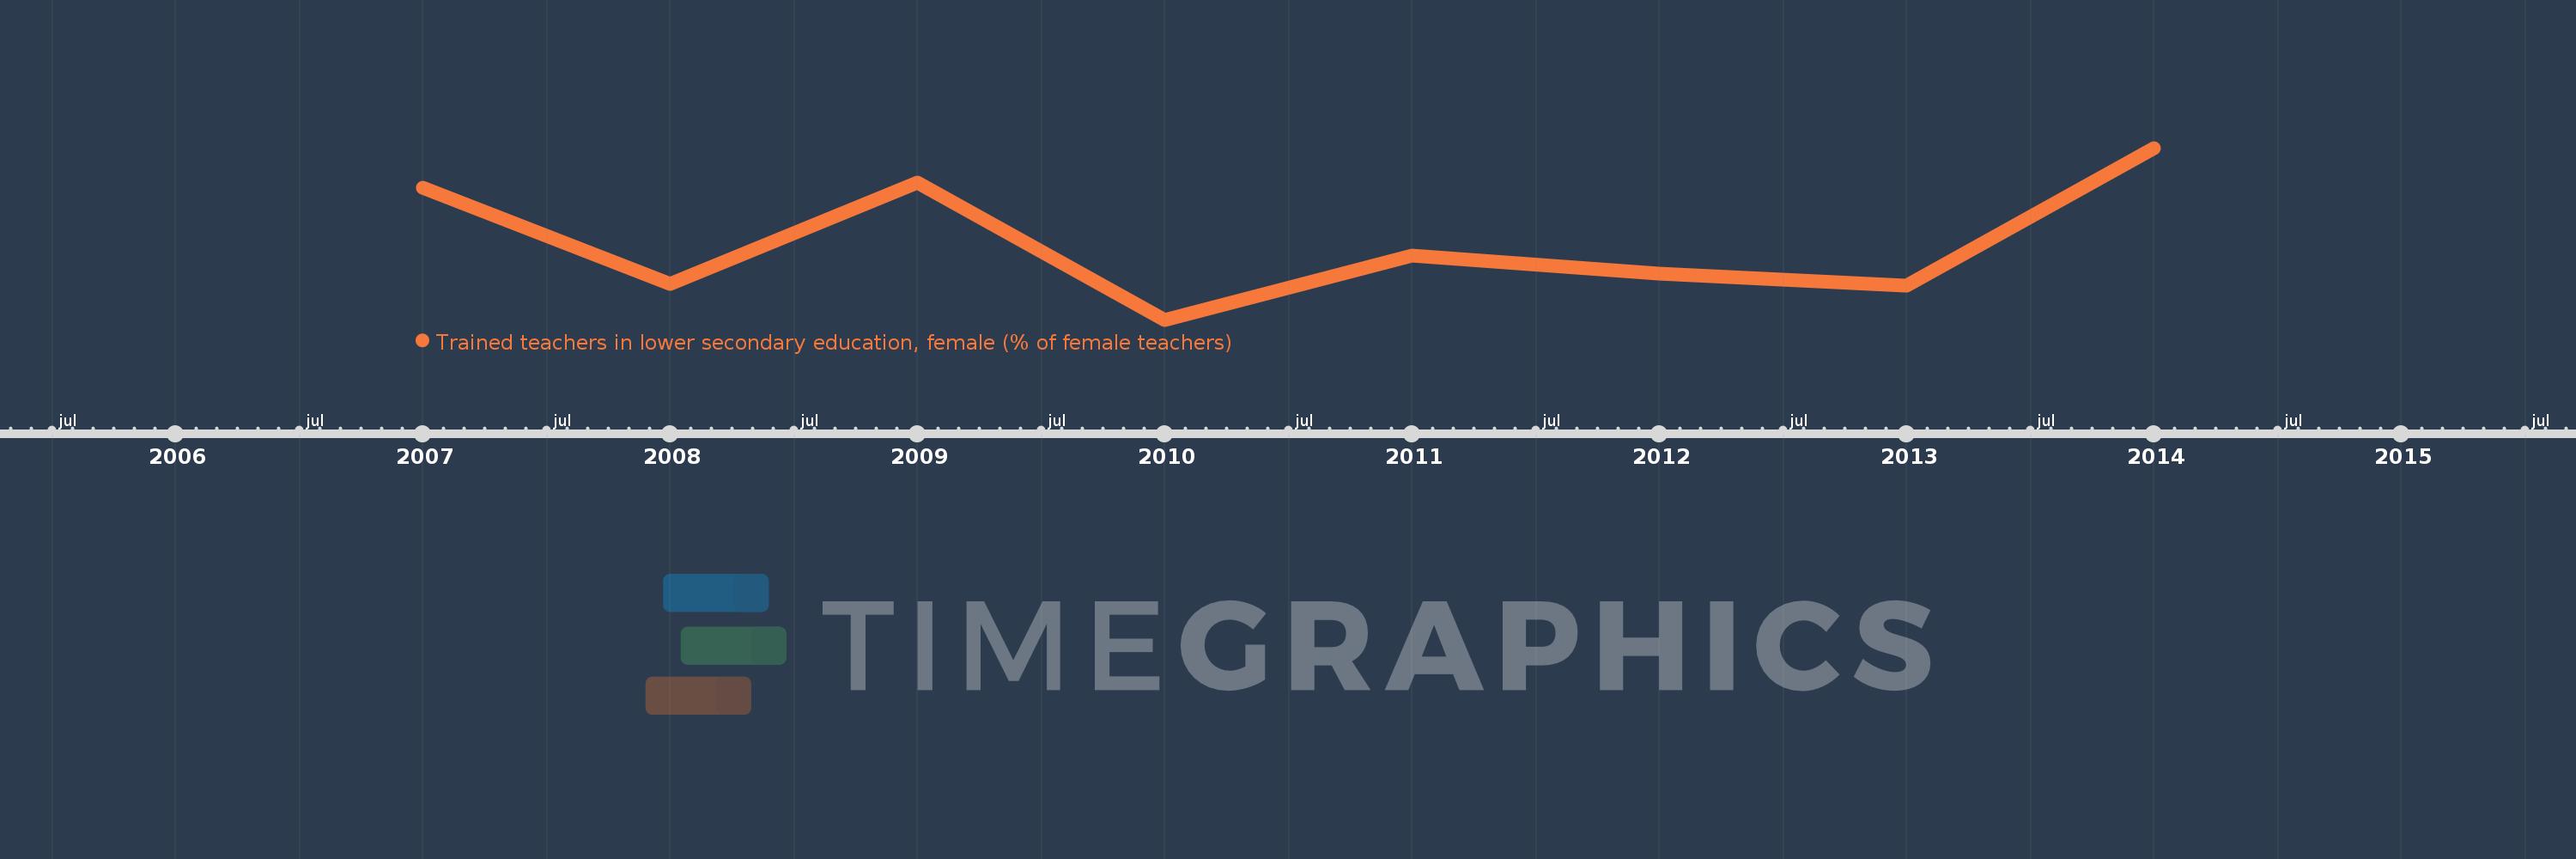
This timeline shows a graph from 2007 to 2014 of Sub-Saharan Africa (IDA & IBRD countries). No data until 2006. Number of actual observations by date: 8.
Source name:
World Development Indicators
Source organization:
United Nations Educational, Scientific, and Cultural Organization (UNESCO) Institute for Statistics.
Categories, topics:
Education
Last updated:
apr 23, 2017
Indicators value changes by year
Meaning:
72.683
Minimum:
64.565
jan 1, 2010
Maximum:
82.561
jan 1, 2014
At the date of observation
Value
Absolute change
Change from the previous value
jan 1, 2007
78.354
+78.354
0.0%
jan 1, 2008
68.313
-10.041
-12.81%
jan 1, 2009
78.908
+10.595
15.51%
jan 1, 2010
64.565
-14.343
-18.18%
jan 1, 2011
71.268
+6.703
10.38%
jan 1, 2012
69.378
-1.89
-2.65%
jan 1, 2013
68.12
-1.258
-1.81%
jan 1, 2014
82.561
+14.441
21.2%
Ranking of countries by current statistics by years
