29
/
en
AIzaSyAYiBZKx7MnpbEhh9jyipgxe19OcubqV5w
April 1, 2024
174901
Lao PDR
LAO
true
2
1
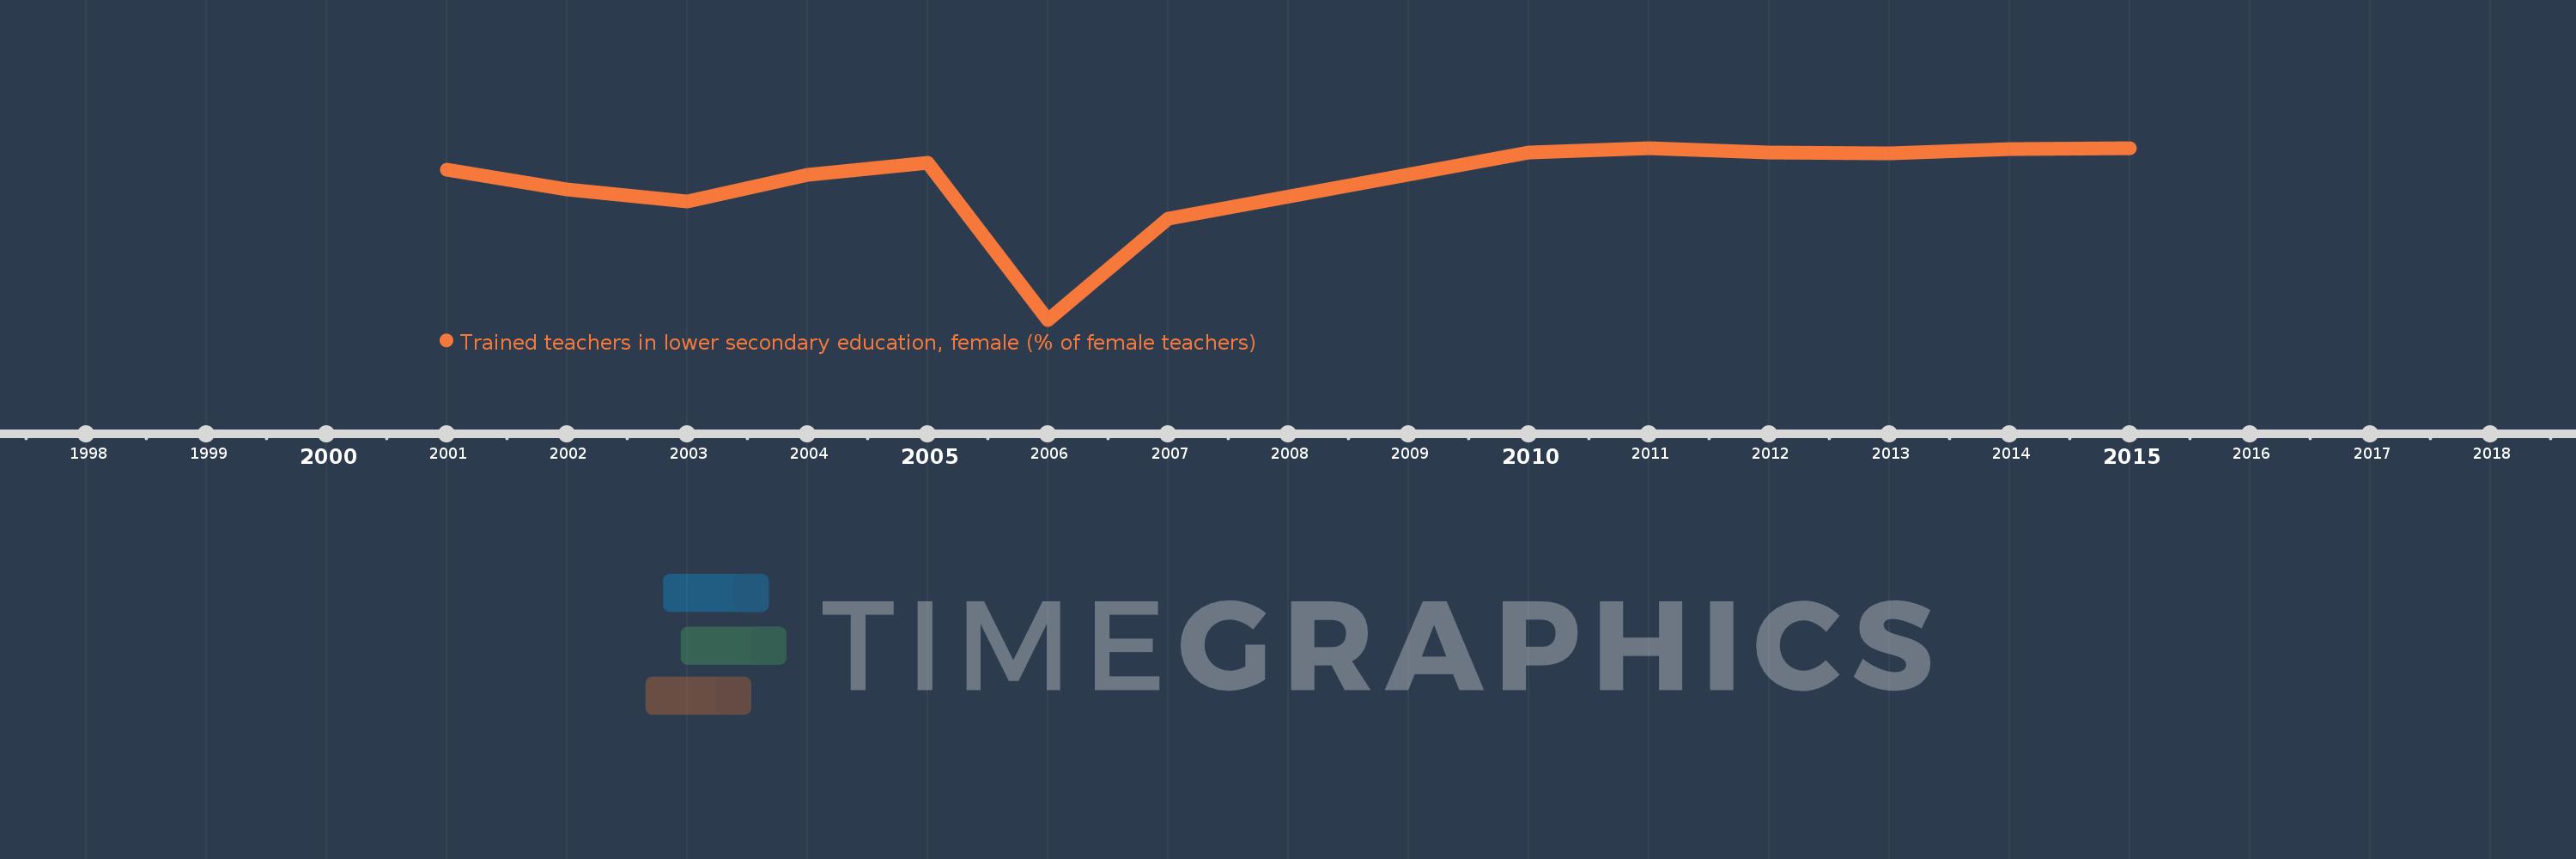
Trained teachers in lower secondary education, female (% of female teachers)
2015,2014,2013,2012,2011,2010,2007,2006,2005,2004,2003,2002,2001
This statistics in other country:
Timeline:
This timeline shows a graph from 2001 to 2015 of Lao PDR. No data until 2000. Number of actual observations by date: 13.
Source name:
World Development Indicators
Source organization:
United Nations Educational, Scientific, and Cultural Organization (UNESCO) Institute for Statistics.
Categories, topics:
Education
Last updated:
apr 23, 2017
Indicators value changes by year
Minimum:
92.493
jan 1, 2006
Maximum:
99.692
jan 1, 2015
At the date of observation
Value
Absolute change
Change from previous value
jan 1, 2001
98.79
+98.79
0.0%
jan 1, 2002
97.953
-0.837
-0.85%
jan 1, 2003
97.453
-0.5
-0.51%
jan 1, 2004
98.559
+1.105
1.13%
jan 1, 2005
99.08
+0.521
0.53%
jan 1, 2006
92.493
-6.587
-6.65%
jan 1, 2007
96.714
+4.221
4.56%
jan 1, 2010
99.516
+2.802
2.9%
jan 1, 2011
99.683
+0.166
0.17%
jan 1, 2012
99.509
-0.174
-0.17%
jan 1, 2013
99.463
-0.045
-0.05%
jan 1, 2014
99.658
+0.195
0.2%
jan 1, 2015
99.692
+0.034
0.03%
Ranking of countries by current statistics by years


Comments: