29
/
en
AIzaSyAYiBZKx7MnpbEhh9jyipgxe19OcubqV5w
April 1, 2024
283103
Vietnam
VNM
true
2
1
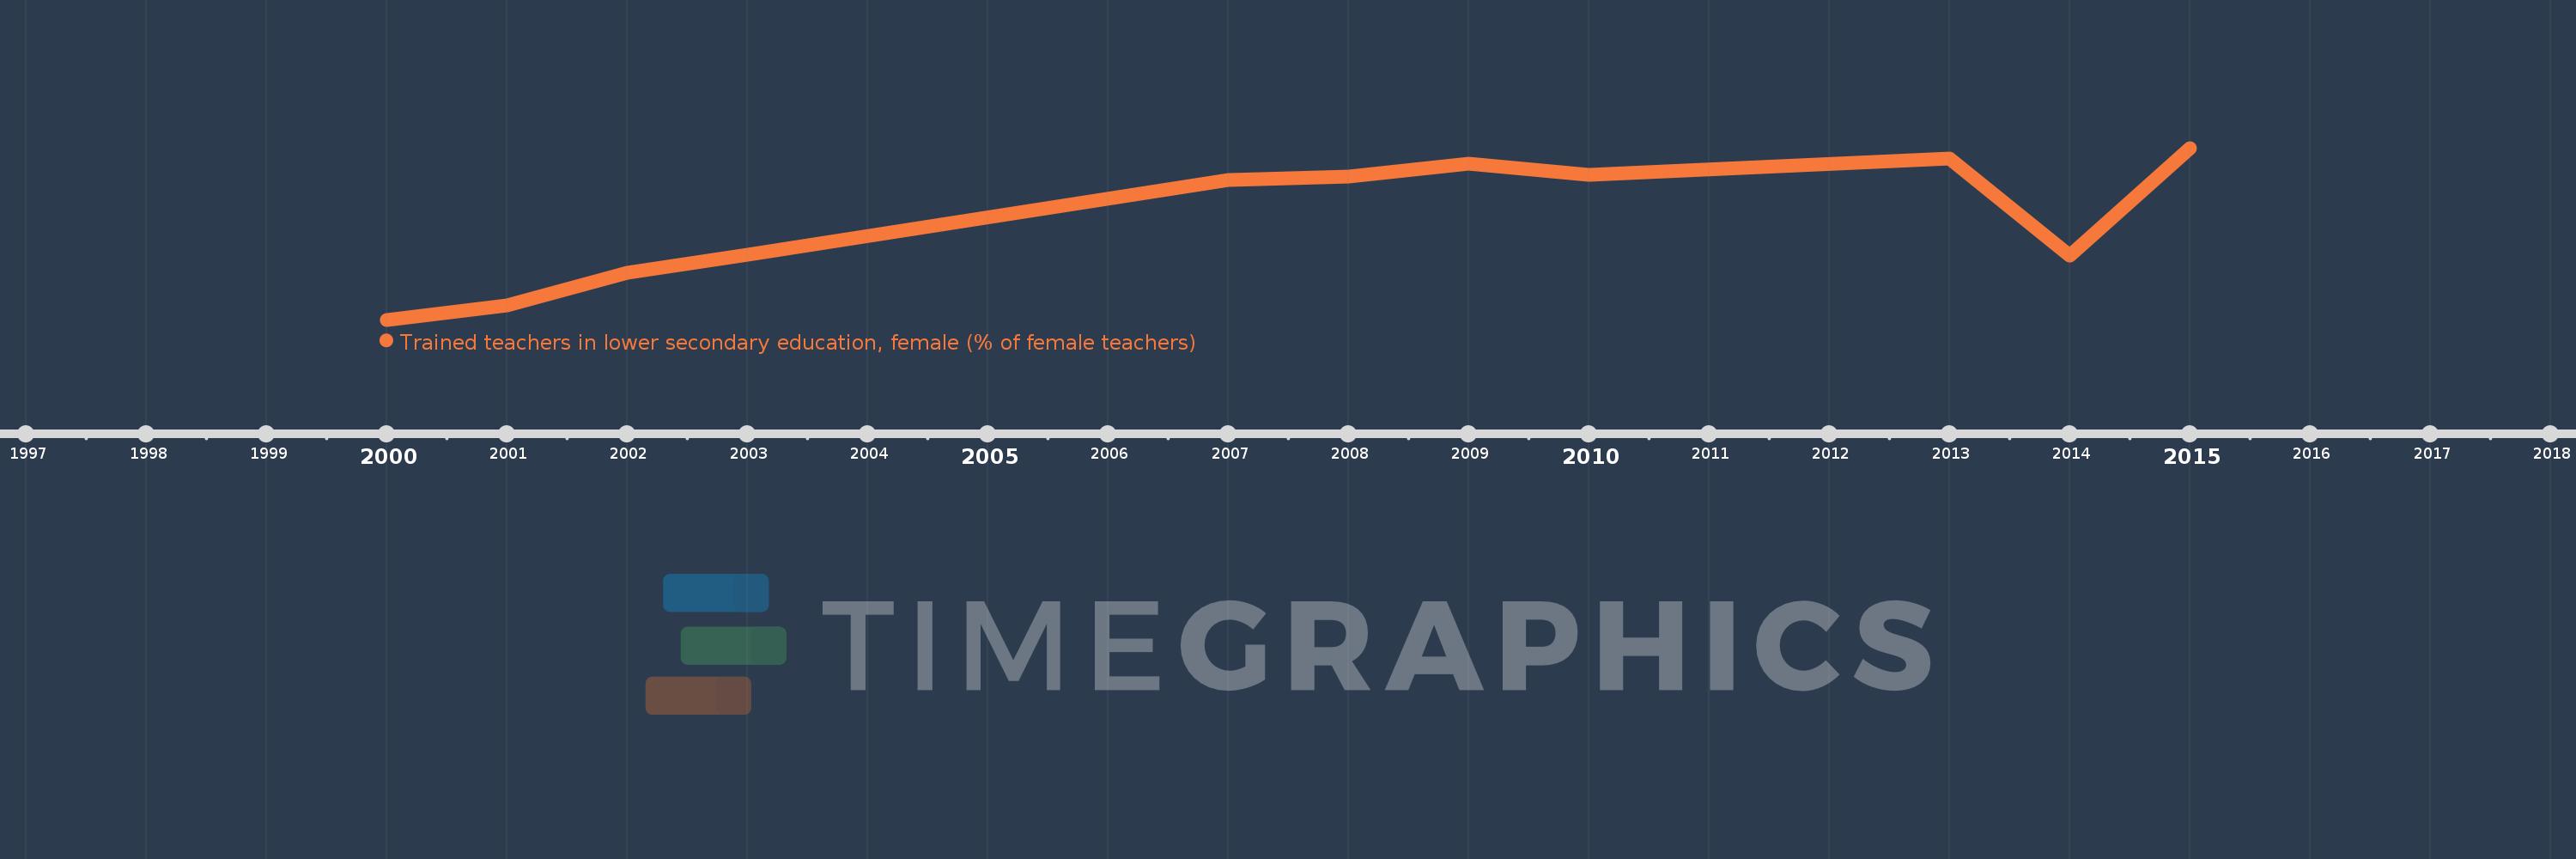
Trained teachers in lower secondary education, female (% of female teachers)
2015,2014,2013,2010,2009,2008,2007,2003,2002,2001,2000
This statistics in other country:
Timeline:
This timeline shows a graph from 2000 to 2015 of Vietnam. No data until 1999. Number of actual observations by date: 11.
Source name:
World Development Indicators
Source organization:
United Nations Educational, Scientific, and Cultural Organization (UNESCO) Institute for Statistics.
Categories, topics:
Education
Last updated:
apr 23, 2017
Indicators value changes by year
At the date of observation
Value
Absolute change
Change from previous value
jan 1, 2000
86.82
+86.82
0.0%
jan 1, 2001
87.945
+1.124
1.3%
jan 1, 2002
90.4
+2.455
2.79%
jan 1, 2003
91.8
+1.4
1.55%
jan 1, 2007
97.517
+5.717
6.23%
jan 1, 2008
97.787
+0.27
0.28%
jan 1, 2009
98.812
+1.024
1.05%
jan 1, 2010
97.936
-0.875
-0.89%
jan 1, 2013
99.202
+1.266
1.29%
jan 1, 2014
91.774
-7.428
-7.49%
jan 1, 2015
100.0
+8.226
8.96%
Ranking of countries by current statistics by years


Comments: