29
/
en
AIzaSyAYiBZKx7MnpbEhh9jyipgxe19OcubqV5w
April 1, 2024
121619
Dominica
DMA
true
2
1
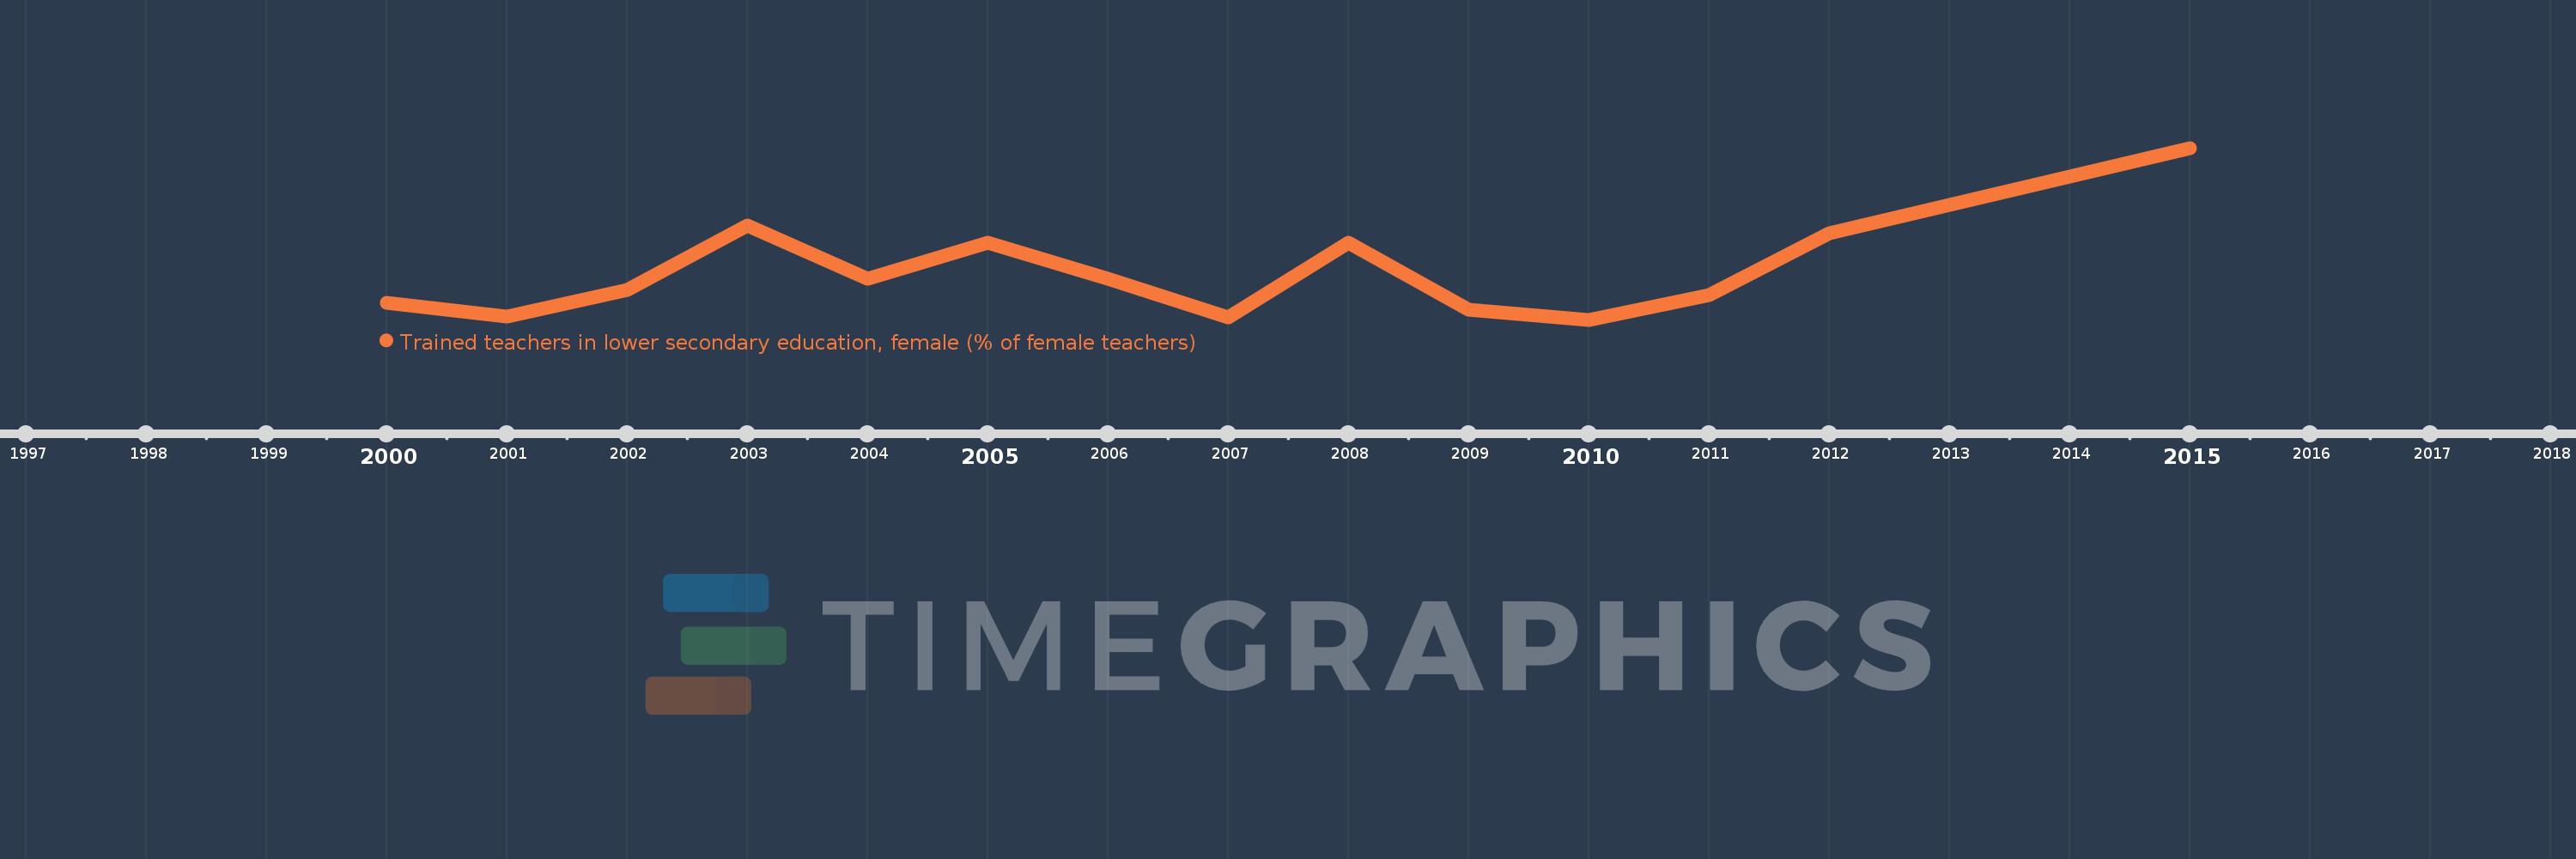
Trained teachers in lower secondary education, female (% of female teachers)
2015,2012,2011,2010,2009,2008,2007,2006,2005,2004,2003,2002,2001,2000
This statistics in other country:
Timeline:
This timeline shows a graph from 2000 to 2015 of Dominica. No data until 1999. Number of actual observations by date: 14.
Source name:
World Development Indicators
Source organization:
United Nations Educational, Scientific, and Cultural Organization (UNESCO) Institute for Statistics.
Categories, topics:
Education
Last updated:
apr 23, 2017
Indicators value changes by year
Minimum:
30.542
jan 1, 2010
Maximum:
47.619
jan 1, 2015
At the date of observation
Value
Absolute change
Change from previous value
jan 1, 2000
32.184
+32.184
0.0%
jan 1, 2001
30.857
-1.327
-4.12%
jan 1, 2002
33.52
+2.662
8.63%
jan 1, 2003
39.904
+6.384
19.05%
jan 1, 2004
34.595
-5.309
-13.31%
jan 1, 2005
38.235
+3.641
10.52%
jan 1, 2006
34.653
-3.582
-9.37%
jan 1, 2007
30.769
-3.884
-11.21%
jan 1, 2008
38.235
+7.466
24.26%
jan 1, 2009
31.527
-6.708
-17.54%
jan 1, 2010
30.542
-0.985
-3.12%
jan 1, 2011
33.01
+2.468
8.08%
jan 1, 2012
39.109
+6.099
18.48%
jan 1, 2015
47.619
+8.51
21.76%
Ranking of countries by current statistics by years


Comments: