29
/
en
AIzaSyAYiBZKx7MnpbEhh9jyipgxe19OcubqV5w
April 1, 2024
44727
Least developed countries: UN classification
LDC
false
2
1
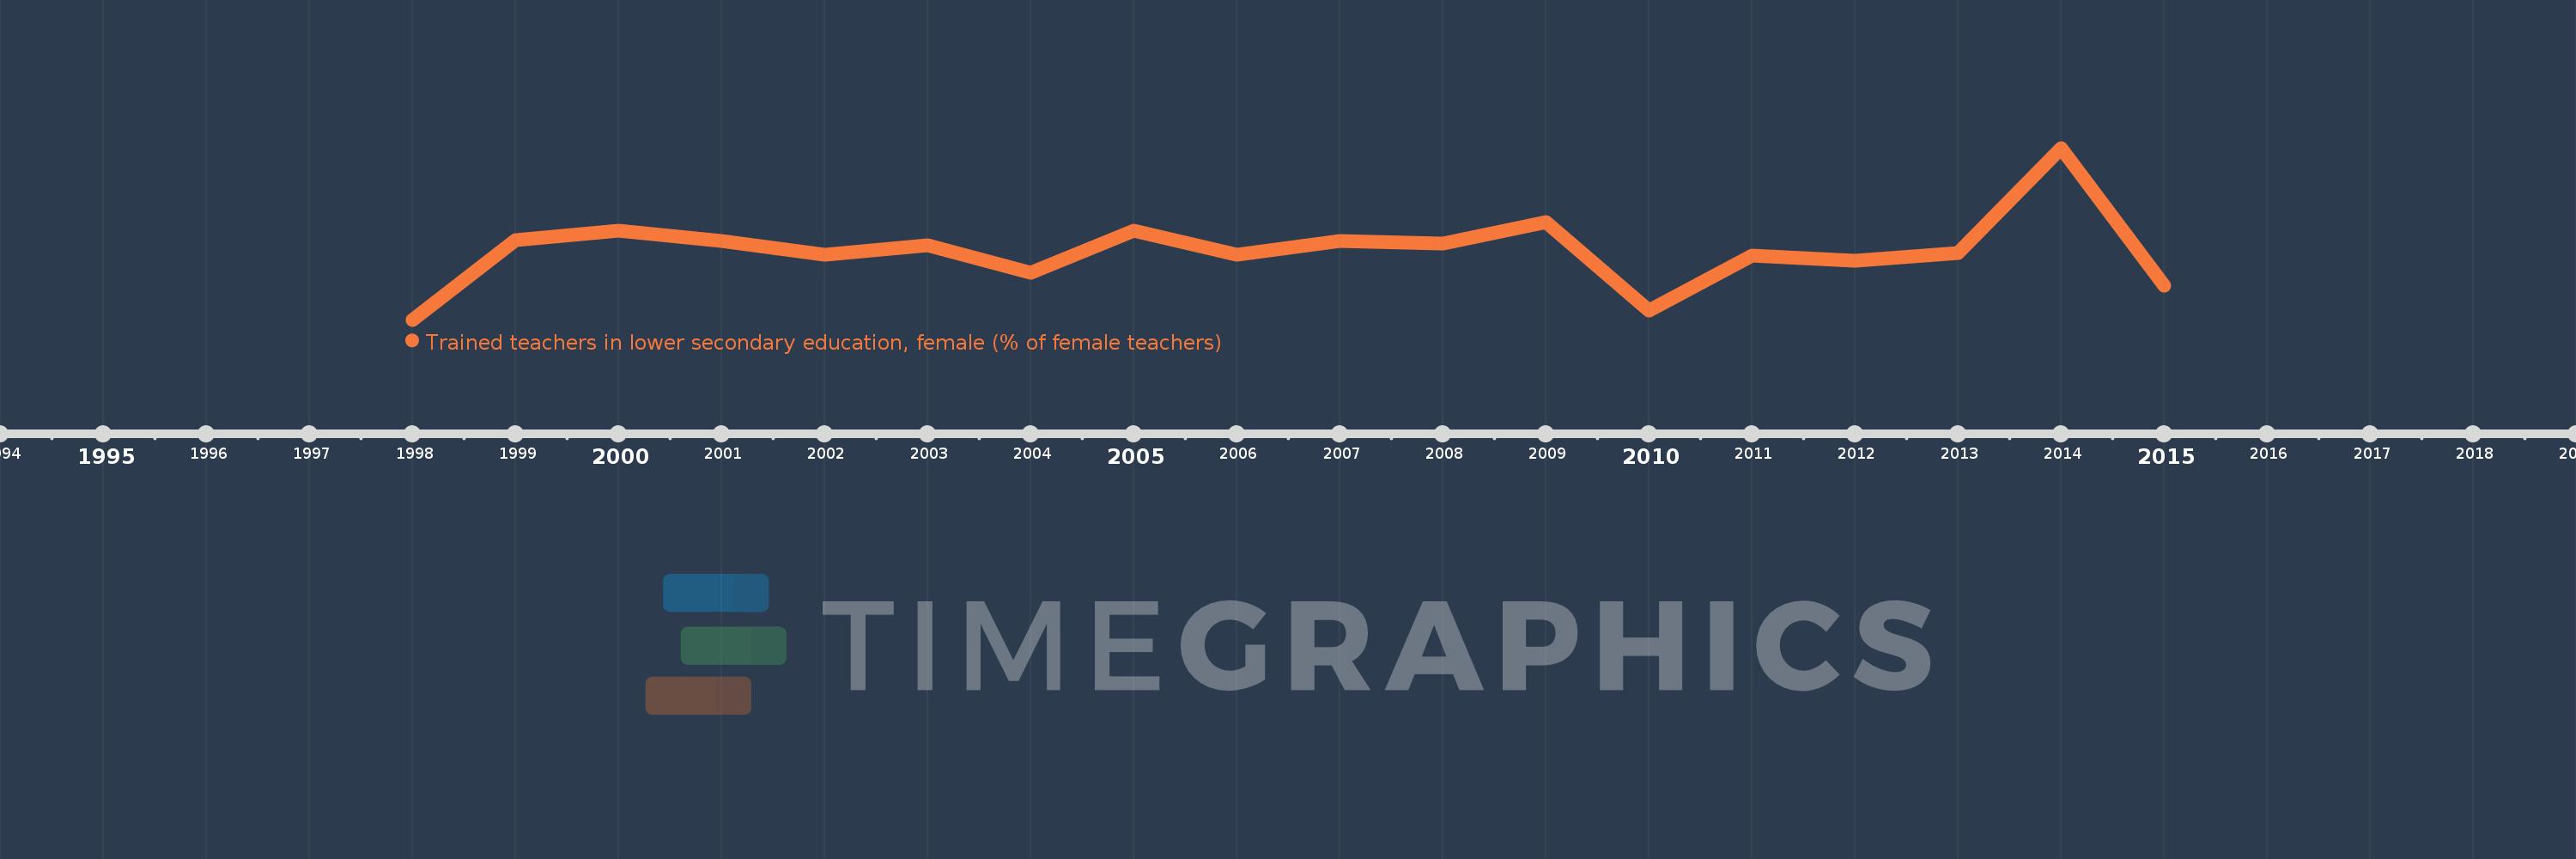
Trained teachers in lower secondary education, female (% of female teachers)
2015,2014,2013,2012,2011,2010,2009,2008,2007,2006,2005,2004,2003,2002,2001,2000,1999,1998
This statistics in other country:
Timeline:
This timeline shows a graph from 1998 to 2015 of Least developed countries: UN classification. No data until 1997. Number of actual observations by date: 18.
Source name:
World Development Indicators
Source organization:
United Nations Educational, Scientific, and Cultural Organization (UNESCO) Institute for Statistics.
Categories, topics:
Education
Last updated:
apr 23, 2017
Indicators value changes by year
Minimum:
63.503
jan 1, 1998
Maximum:
88.893
jan 1, 2014
At the date of observation
Value
Absolute change
Change from previous value
jan 1, 1998
63.503
+63.503
0.0%
jan 1, 1999
75.32
+11.816
18.61%
jan 1, 2000
76.608
+1.289
1.71%
jan 1, 2001
75.198
-1.411
-1.84%
jan 1, 2002
73.083
-2.114
-2.81%
jan 1, 2003
74.481
+1.398
1.91%
jan 1, 2004
70.501
-3.98
-5.34%
jan 1, 2005
76.726
+6.225
8.83%
jan 1, 2006
73.061
-3.666
-4.78%
jan 1, 2007
75.11
+2.05
2.81%
jan 1, 2008
74.768
-0.343
-0.46%
jan 1, 2009
77.965
+3.197
4.28%
jan 1, 2010
64.868
-13.097
-16.8%
jan 1, 2011
72.973
+8.105
12.49%
jan 1, 2012
72.286
-0.687
-0.94%
jan 1, 2013
73.391
+1.106
1.53%
jan 1, 2014
88.893
+15.502
21.12%
jan 1, 2015
68.505
-20.388
-22.94%
Ranking of countries by current statistics by years


Comments: