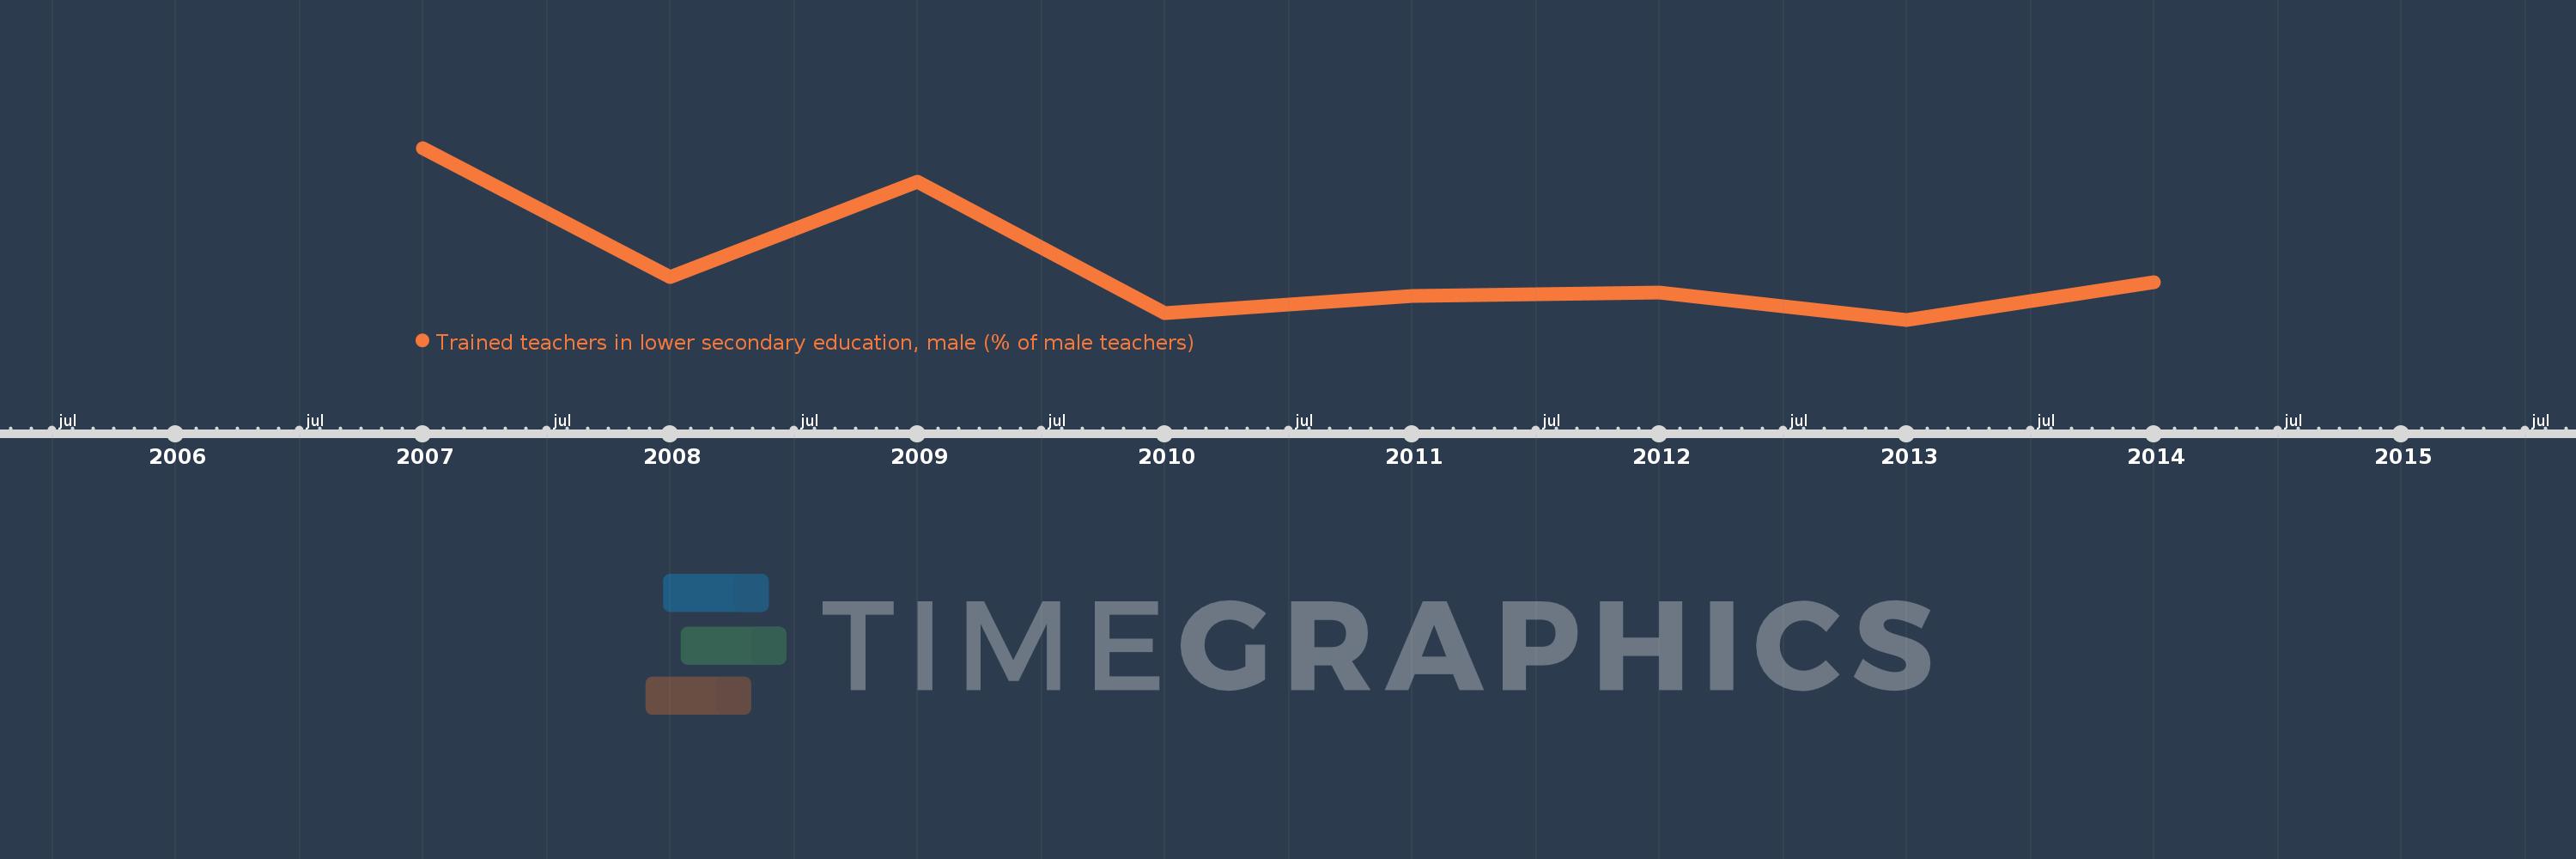
This timeline shows a graph from 2007 to 2014 of Sub-Saharan Africa (excluding high income). No data until 2006. Number of actual observations by date: 8.
Source name:
World Development Indicators
Source organization:
United Nations Educational, Scientific, and Cultural Organization (UNESCO) Institute for Statistics.
Categories, topics:
Education
Last updated:
apr 23, 2017
Indicators value changes by year
Meaning:
62.734
Minimum:
59.482
jan 1, 2013
Maximum:
69.449
jan 1, 2007
At the date of observation
Value
Absolute change
Change from the previous value
jan 1, 2007
69.449
+69.449
0.0%
jan 1, 2008
61.968
-7.482
-10.77%
jan 1, 2009
67.474
+5.506
8.89%
jan 1, 2010
59.889
-7.585
-11.24%
jan 1, 2011
60.884
+0.995
1.66%
jan 1, 2012
61.063
+0.178
0.29%
jan 1, 2013
59.482
-1.58
-2.59%
jan 1, 2014
61.666
+2.183
3.67%
Ranking of countries by current statistics by years
