29
/
en
AIzaSyAYiBZKx7MnpbEhh9jyipgxe19OcubqV5w
April 1, 2024
141228
Ghana
GHA
true
2
1
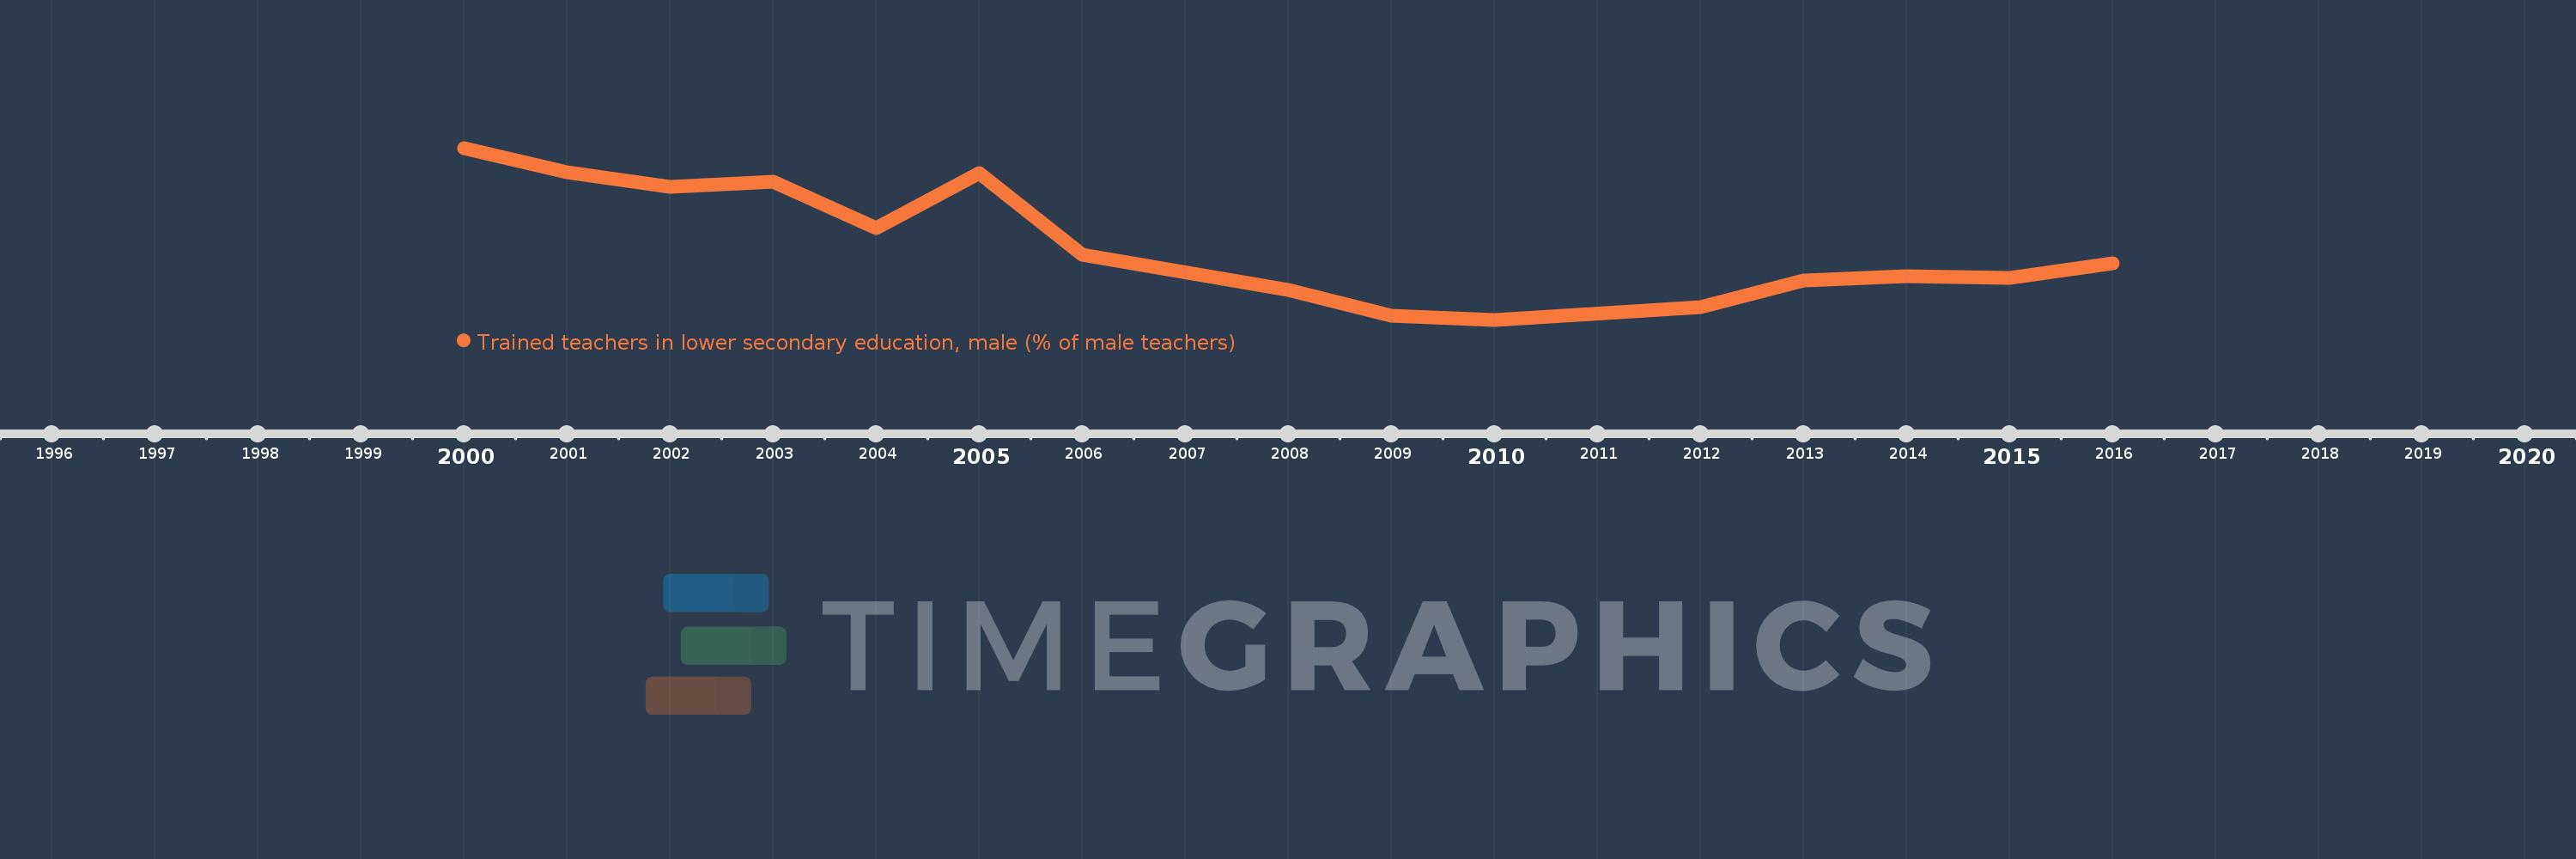
Trained teachers in lower secondary education, male (% of male teachers)
2016,2015,2014,2013,2012,2010,2009,2008,2006,2005,2004,2003,2002,2001,2000
This statistics in other country:
Timeline:
This timeline shows a graph from 2000 to 2016 of Ghana. No data until 1999. Number of actual observations by date: 15.
Source name:
World Development Indicators
Source organization:
United Nations Educational, Scientific, and Cultural Organization (UNESCO) Institute for Statistics.
Categories, topics:
Education
Last updated:
apr 23, 2017
Indicators value changes by year
Minimum:
59.399
jan 1, 2010
Maximum:
79.269
jan 1, 2000
At the date of observation
Value
Absolute change
Change from previous value
jan 1, 2000
79.269
+79.269
0.0%
jan 1, 2001
76.492
-2.776
-3.5%
jan 1, 2002
74.742
-1.751
-2.29%
jan 1, 2003
75.402
+0.66
0.88%
jan 1, 2004
70.035
-5.366
-7.12%
jan 1, 2005
76.351
+6.315
9.02%
jan 1, 2006
66.887
-9.464
-12.4%
jan 1, 2008
62.871
-4.016
-6.0%
jan 1, 2009
59.894
-2.977
-4.73%
jan 1, 2010
59.399
-0.495
-0.83%
jan 1, 2012
60.836
+1.437
2.42%
jan 1, 2013
63.915
+3.079
5.06%
jan 1, 2014
64.403
+0.488
0.76%
jan 1, 2015
64.211
-0.192
-0.3%
jan 1, 2016
65.93
+1.719
2.68%
Ranking of countries by current statistics by years


Comments: