29
/
en
AIzaSyAYiBZKx7MnpbEhh9jyipgxe19OcubqV5w
April 1, 2024
252567
St. Vincent and the Grenadines
VCT
true
2
1
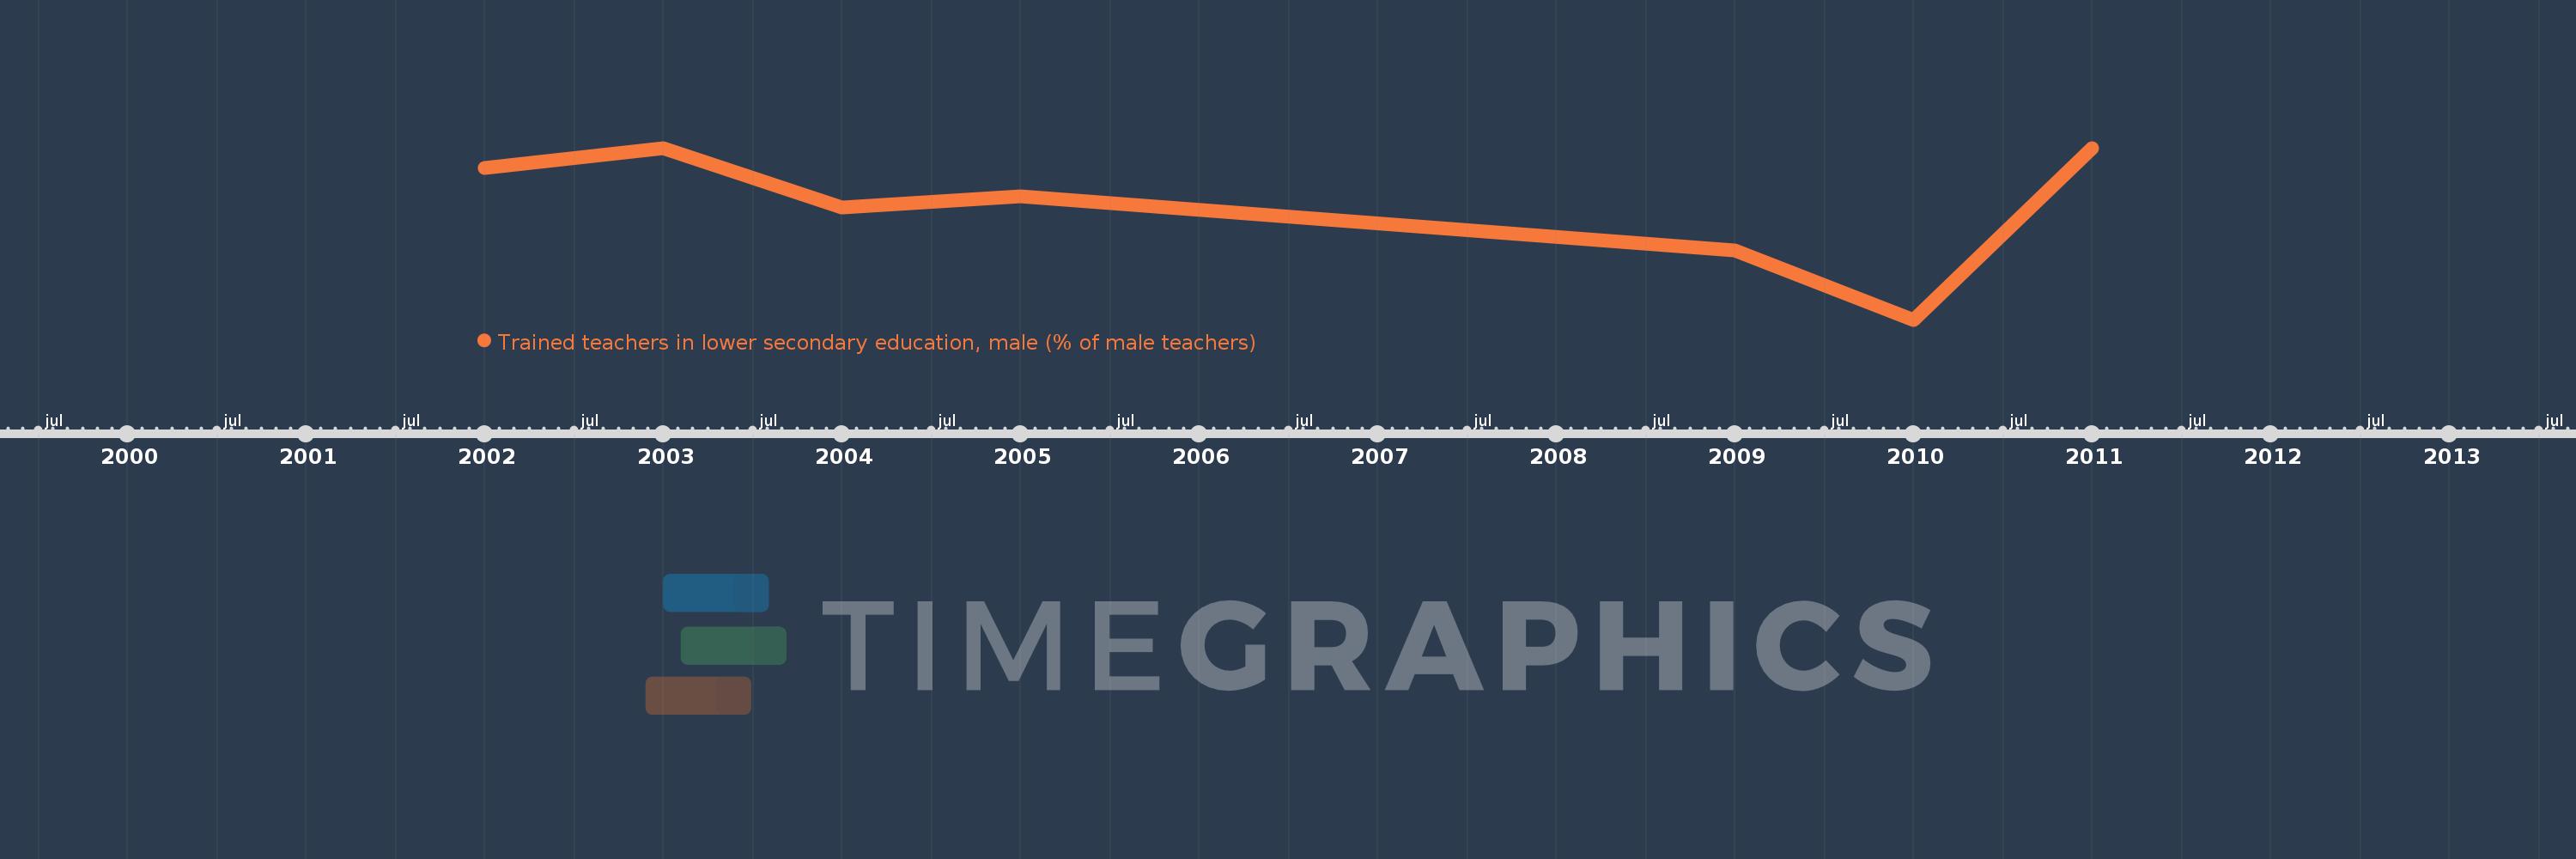
Trained teachers in lower secondary education, male (% of male teachers)
2011,2010,2009,2005,2004,2003,2002
This statistics in other country:
Timeline:
This timeline shows a graph from 2002 to 2011 of St. Vincent and the Grenadines. No data until 2001. Number of actual observations by date: 7.
Source name:
World Development Indicators
Source organization:
United Nations Educational, Scientific, and Cultural Organization (UNESCO) Institute for Statistics.
Categories, topics:
Education
Last updated:
apr 23, 2017
Indicators value changes by year
Minimum:
39.051
jan 1, 2010
Maximum:
65.359
jan 1, 2011
At the date of observation
Value
Absolute change
Change from previous value
jan 1, 2002
62.295
+62.295
0.0%
jan 1, 2003
65.289
+2.994
4.81%
jan 1, 2004
56.25
-9.039
-13.84%
jan 1, 2005
57.955
+1.705
3.03%
jan 1, 2009
49.624
-8.33
-14.37%
jan 1, 2010
39.051
-10.573
-21.31%
jan 1, 2011
65.359
+26.308
67.37%
Ranking of countries by current statistics by years


Comments: