29
/
en
AIzaSyAYiBZKx7MnpbEhh9jyipgxe19OcubqV5w
April 1, 2024
131282
Ethiopia
ETH
true
2
1
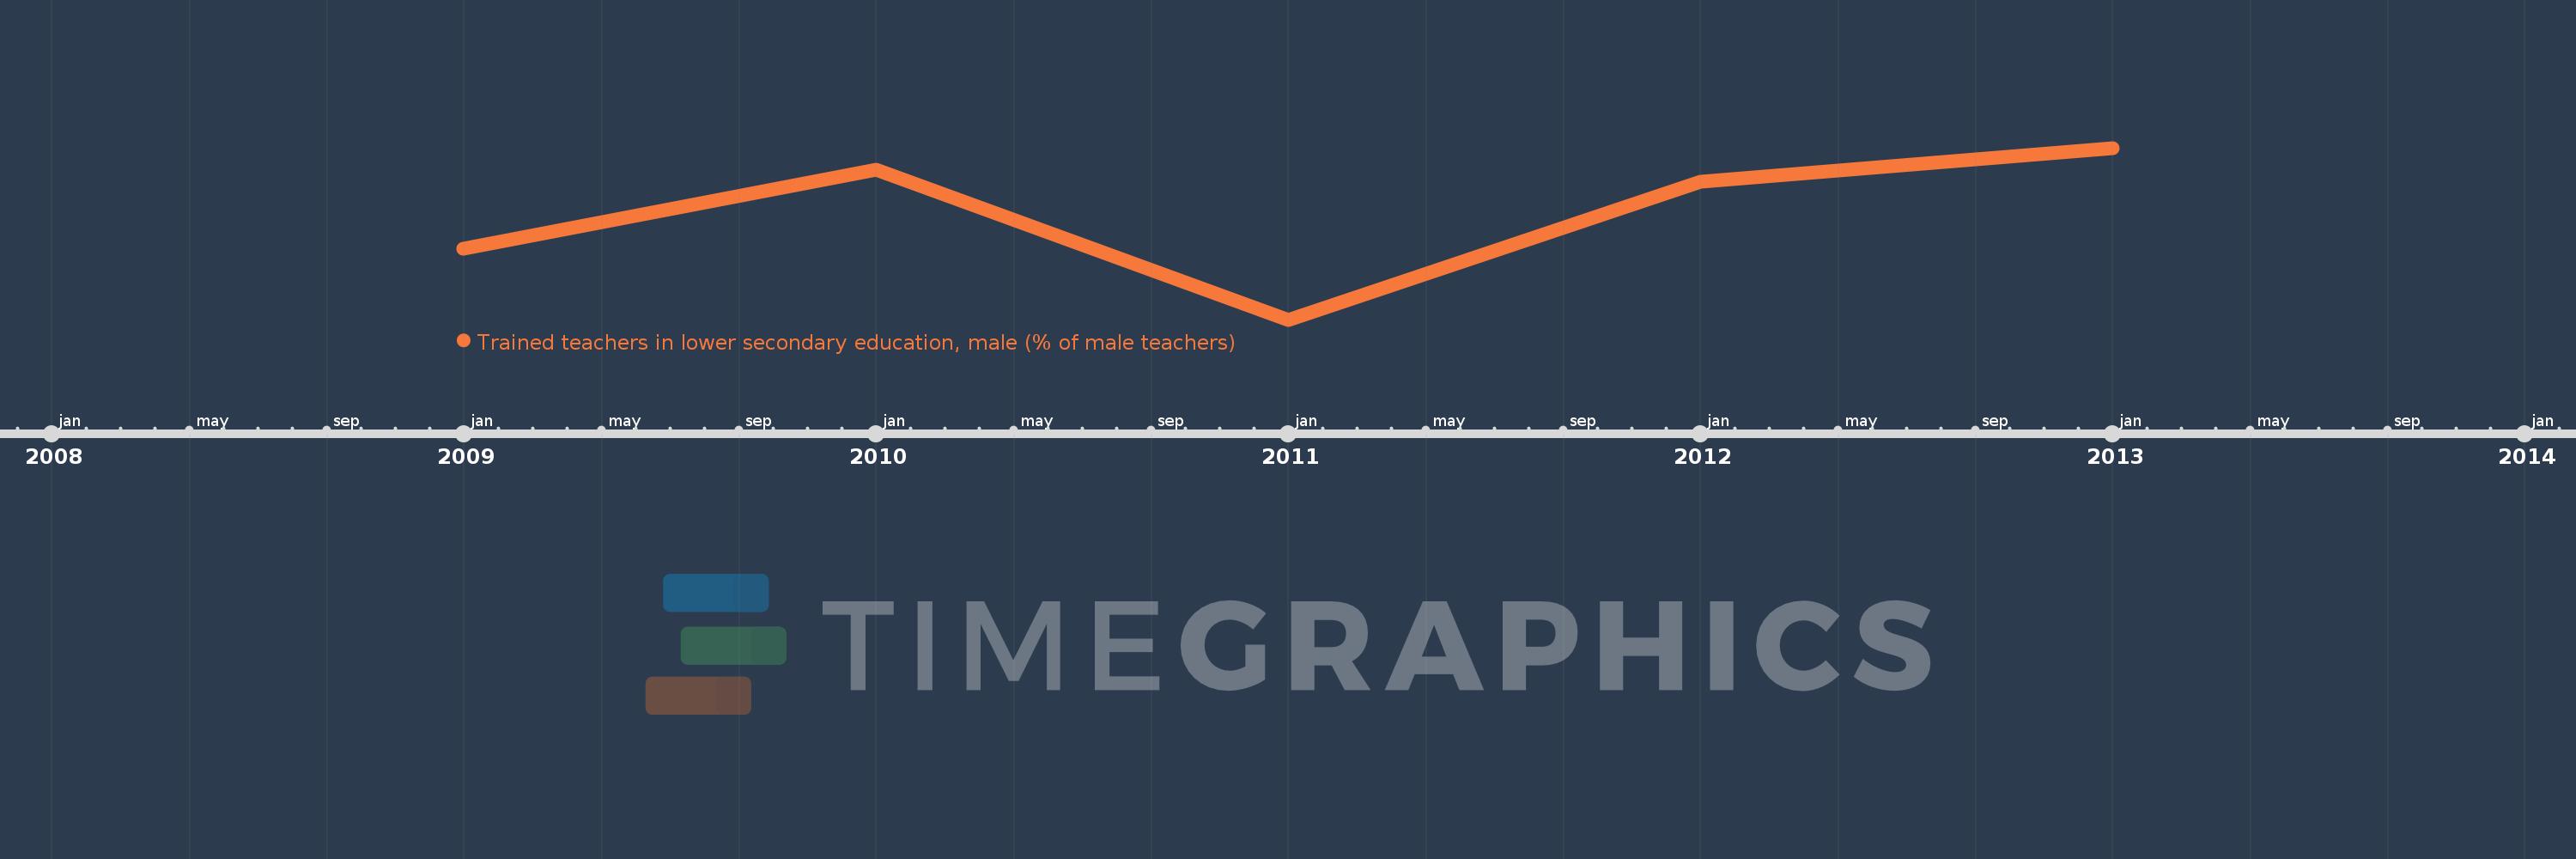
Trained teachers in lower secondary education, male (% of male teachers)
2013,2012,2011,2010,2009
This statistics in other country:
Timeline:
This timeline shows a graph from 2009 to 2013 of Ethiopia. No data until 2008. Number of actual observations by date: 5.
Source name:
World Development Indicators
Source organization:
United Nations Educational, Scientific, and Cultural Organization (UNESCO) Institute for Statistics.
Categories, topics:
Education
Last updated:
apr 23, 2017
Indicators value changes by year
Maximum:
75.061
jan 1, 2013
At the date of observation
Value
Absolute change
Change from previous value
jan 1, 2009
63.346
+63.346
0.0%
jan 1, 2010
72.511
+9.165
14.47%
jan 1, 2011
55.09
-17.421
-24.03%
jan 1, 2012
71.104
+16.015
29.07%
jan 1, 2013
75.061
+3.957
5.57%
Ranking of countries by current statistics by years


Comments: