29
/
en
AIzaSyAYiBZKx7MnpbEhh9jyipgxe19OcubqV5w
April 1, 2024
39619
IDA only
IDX
false
2
1
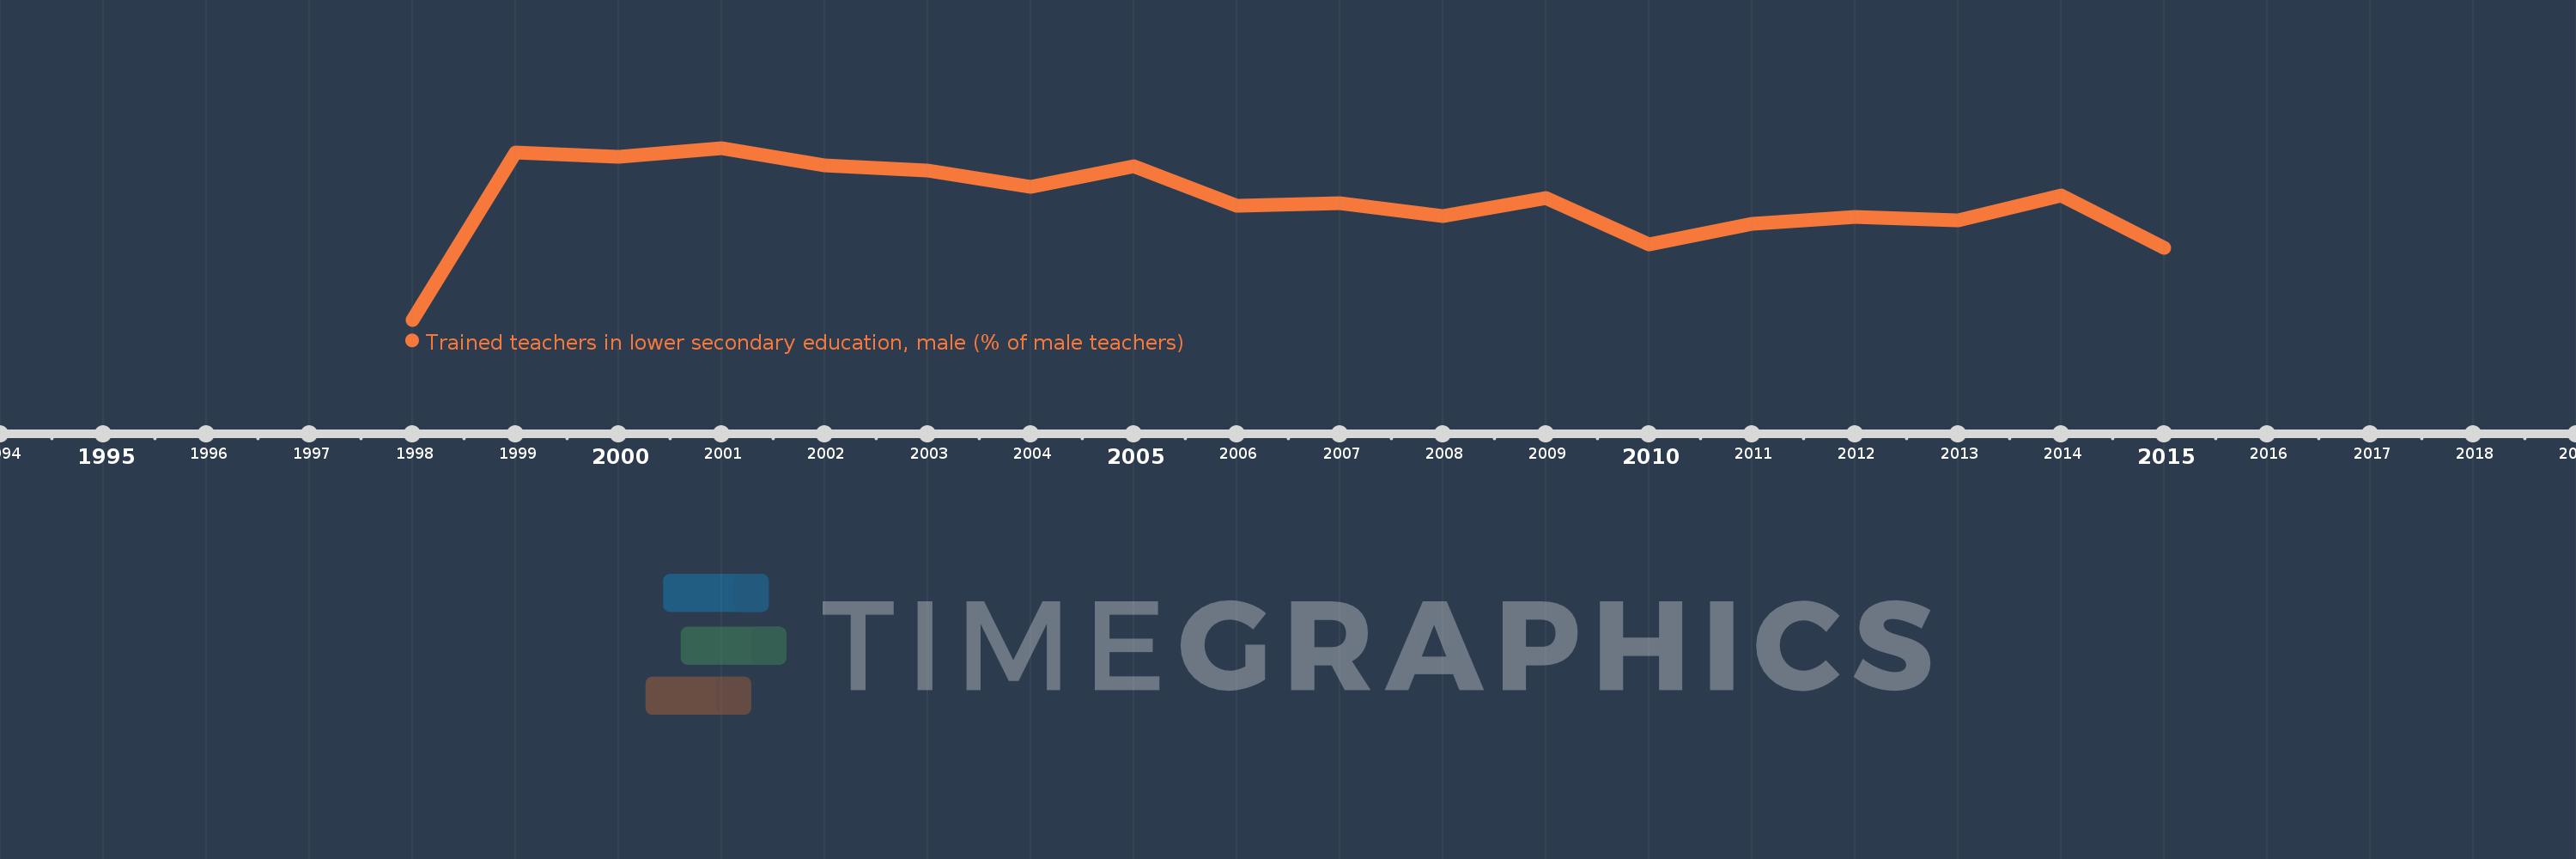
Trained teachers in lower secondary education, male (% of male teachers)
2015,2014,2013,2012,2011,2010,2009,2008,2007,2006,2005,2004,2003,2002,2001,2000,1999,1998
This statistics in other country:
Timeline:
This timeline shows a graph from 1998 to 2015 of IDA only. No data until 1997. Number of actual observations by date: 18.
Source name:
World Development Indicators
Source organization:
United Nations Educational, Scientific, and Cultural Organization (UNESCO) Institute for Statistics.
Categories, topics:
Education
Last updated:
apr 23, 2017
Indicators value changes by year
Minimum:
52.326
jan 1, 1998
Maximum:
69.142
jan 1, 2001
At the date of observation
Value
Absolute change
Change from previous value
jan 1, 1998
52.326
+52.326
0.0%
jan 1, 1999
68.714
+16.389
31.32%
jan 1, 2000
68.245
-0.469
-0.68%
jan 1, 2001
69.142
+0.897
1.31%
jan 1, 2002
67.47
-1.671
-2.42%
jan 1, 2003
66.927
-0.543
-0.81%
jan 1, 2004
65.354
-1.573
-2.35%
jan 1, 2005
67.339
+1.985
3.04%
jan 1, 2006
63.506
-3.833
-5.69%
jan 1, 2007
63.772
+0.265
0.42%
jan 1, 2008
62.452
-1.32
-2.07%
jan 1, 2009
64.25
+1.798
2.88%
jan 1, 2010
59.69
-4.559
-7.1%
jan 1, 2011
61.753
+2.063
3.46%
jan 1, 2012
62.424
+0.671
1.09%
jan 1, 2013
62.073
-0.351
-0.56%
jan 1, 2014
64.508
+2.435
3.92%
jan 1, 2015
59.4
-5.108
-7.92%
Ranking of countries by current statistics by years


Comments: