30
/
AIzaSyAYiBZKx7MnpbEhh9jyipgxe19OcubqV5w
April 1, 2024
57463
South Asia
SAS
false
2
1
PNG, bonds (NFL, current US$)
2016,2015,2014,2013,2012,2011,2010,2009,2008,2007,2006,2005,2004,2003,2002,2001,2000,1999,1998,1997,1996,1995,1994
Public Timelines
FAQ
Menu
Public Timelines
FAQ
For education
For educational institutions
For teachers
For students
Open cabinet
Create
Close
Create a timeline
Public timelines
Library
FAQ
Download
Global statistics library
→
South Asia
→
PNG, bonds (NFL, current US$)
This statistics in other country:
Argentina
Armenia
Botswana
Brazil
Bulgaria
China
Colombia
Costa Rica
Dominican Republic
East Asia & Pacific (excluding high income)
Ecuador
Egypt, Arab Rep.
El Salvador
Europe & Central Asia (excluding high income)
Georgia
Ghana
Guatemala
IDA only
India
Indonesia
Jamaica
Kazakhstan
Lao PDR
Latin America & Caribbean (excluding high income)
Lebanon
Low & middle income
Lower middle income
Malaysia
Mexico
Middle East & North Africa (excluding high income)
Middle income
Mongolia
Nigeria
Pakistan
Panama
Paraguay
Peru
Philippines
Romania
Russian Federation
Serbia
South Africa
South Asia
Sri Lanka
Sub-Saharan Africa (excluding high income)
Thailand
Turkey
Ukraine
Upper middle income
Venezuela, RB
Vietnam
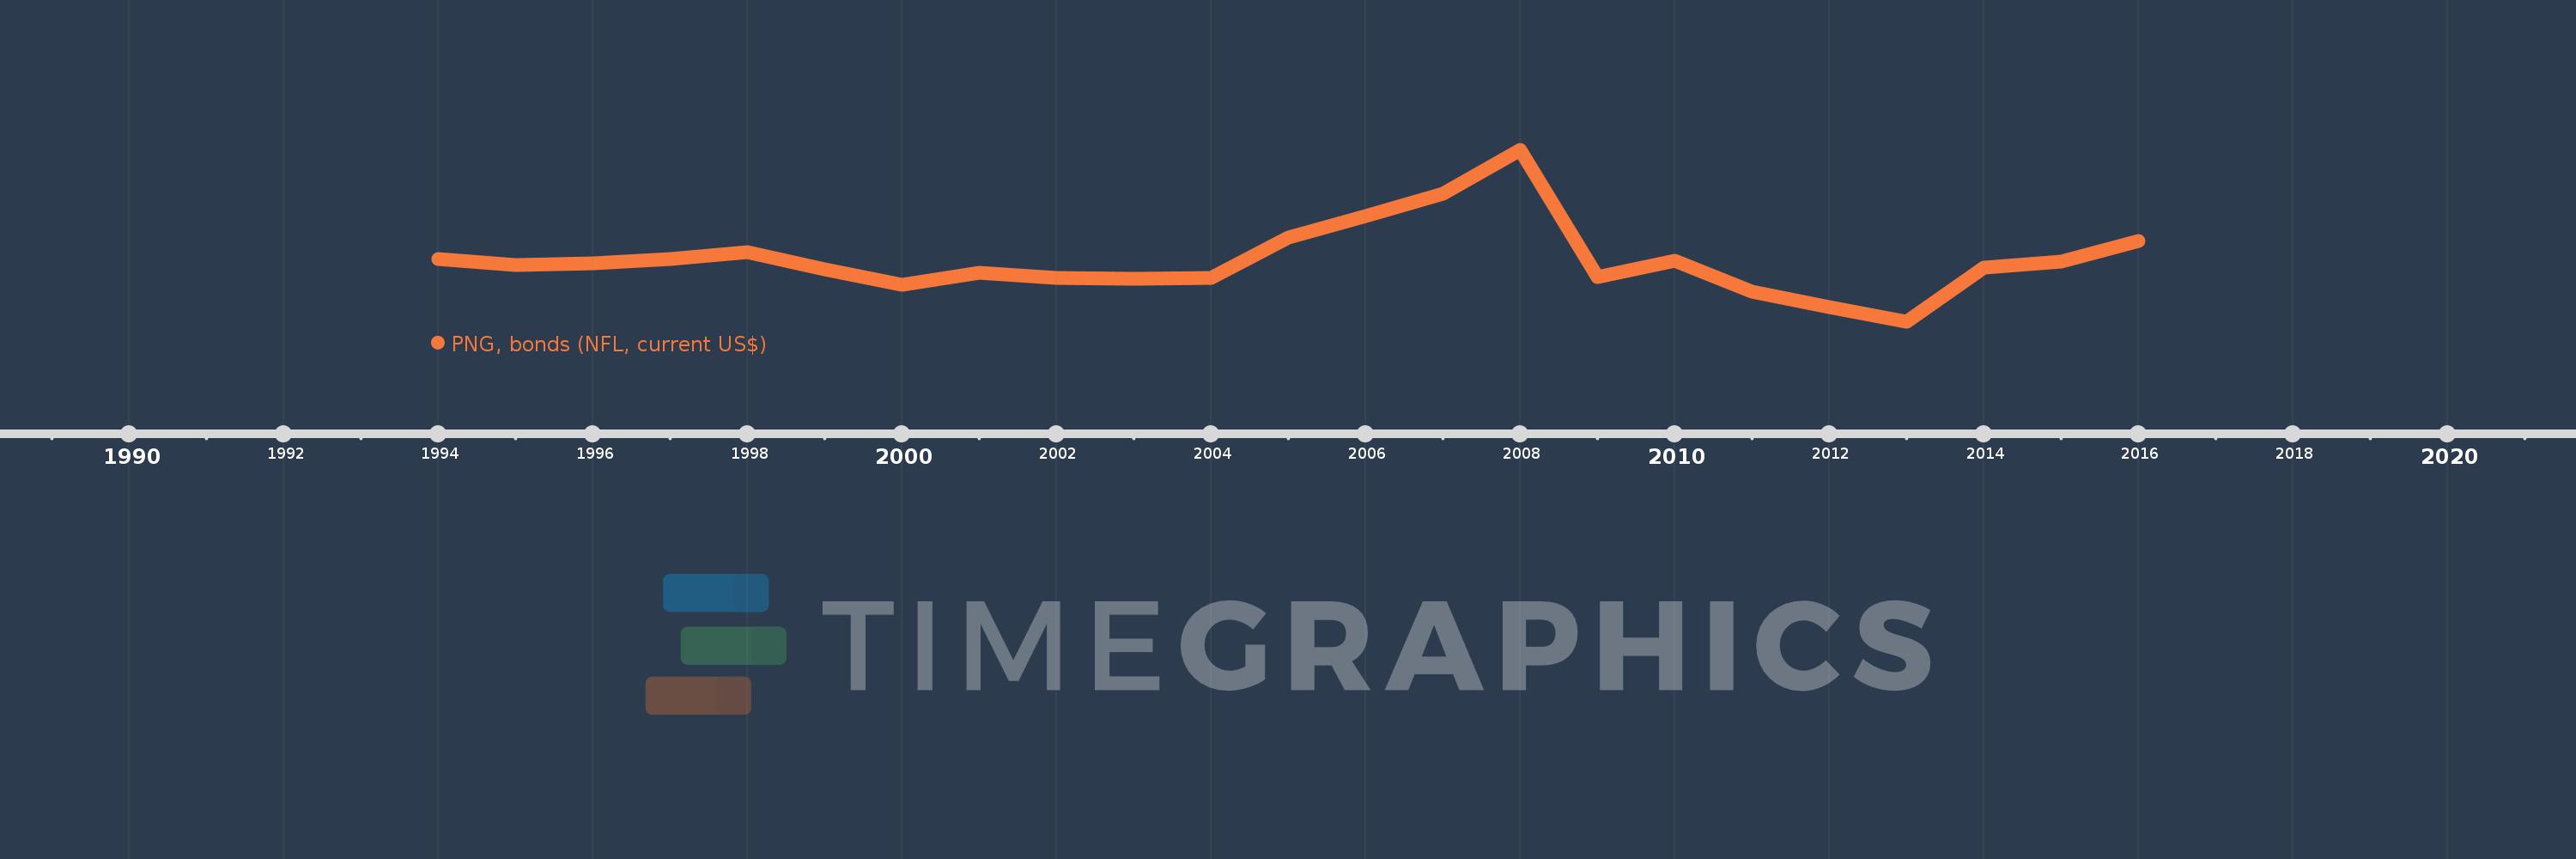
Timeline:
This timeline shows a graph from
1994
to
2016
of South Asia. No data until
1993
. Number of actual observations by date:
23
.
Source name:
World Development Indicators
Source organization:
World Bank, International Debt Statistics.
Categories, topics:
External Debt
Last updated:
apr 23, 2017
Indicators value changes by year
Meaning:
717.329 mln
Minimum:
-3.013 bln
jan 1, 2013
Maximum:
7.384 bln
jan 1, 2008
At the date of observation
Value
Absolute change
Change from the previous value
jan 1, 1994
794.21 mln
+794.21 mln
0.0%
jan 1, 1995
412.341 mln
-381.869 mln
-48.08%
jan 1, 1996
520.0 mln
+107.659 mln
26.11%
jan 1, 1997
784.976 mln
+264.976 mln
50.96%
jan 1, 1998
1.221 bln
+436.233 mln
55.57%
jan 1, 1999
150.79 mln
-1.07 bln
-87.65%
jan 1, 2000
-764.994 mln
-915.784 mln
-607.32%
jan 1, 2001
-35.0 mln
+729.994 mln
-95.42%
jan 1, 2002
-360.949 mln
-325.949 mln
931.28%
jan 1, 2003
-390.295 mln
-29.346 mln
8.13%
jan 1, 2004
-332.272 mln
+58.023 mln
-14.87%
jan 1, 2005
2.08 bln
+2.413 bln
-726.11%
jan 1, 2006
3.403 bln
+1.322 bln
63.57%
jan 1, 2007
4.742 bln
+1.339 bln
39.34%
jan 1, 2008
7.384 bln
+2.642 bln
55.72%
jan 1, 2009
-285.71 mln
-7.669 bln
-103.87%
jan 1, 2010
694.36 mln
+980.07 mln
-343.03%
jan 1, 2011
-1.163 bln
-1.857 bln
-267.48%
jan 1, 2012
-2.11 bln
-947.185 mln
81.45%
jan 1, 2013
-3.013 bln
-903.206 mln
42.8%
jan 1, 2014
252.959 mln
+3.266 bln
-108.39%
jan 1, 2015
634.622 mln
+381.663 mln
150.88%
jan 1, 2016
1.88 bln
+1.246 bln
196.28%
Ranking of countries by current statistics by years
About & Feedback
Terms
Privacy
Library
2024
©
Time.Graphics
Support 24/7
Cabinet
Get premium
Donate
The service accepts bank transfer (ACH, Wire) or cards (Visa, MasterCard, etc). Processed by Stripe.
Secured with SSL
Excellent (Trustpilot Reviews)
Based on 115+ reviews
Write your own review on
Trustpilot.com
