29
/
en
AIzaSyAYiBZKx7MnpbEhh9jyipgxe19OcubqV5w
April 1, 2024
281469
Venezuela, RB
VEN
true
2
1
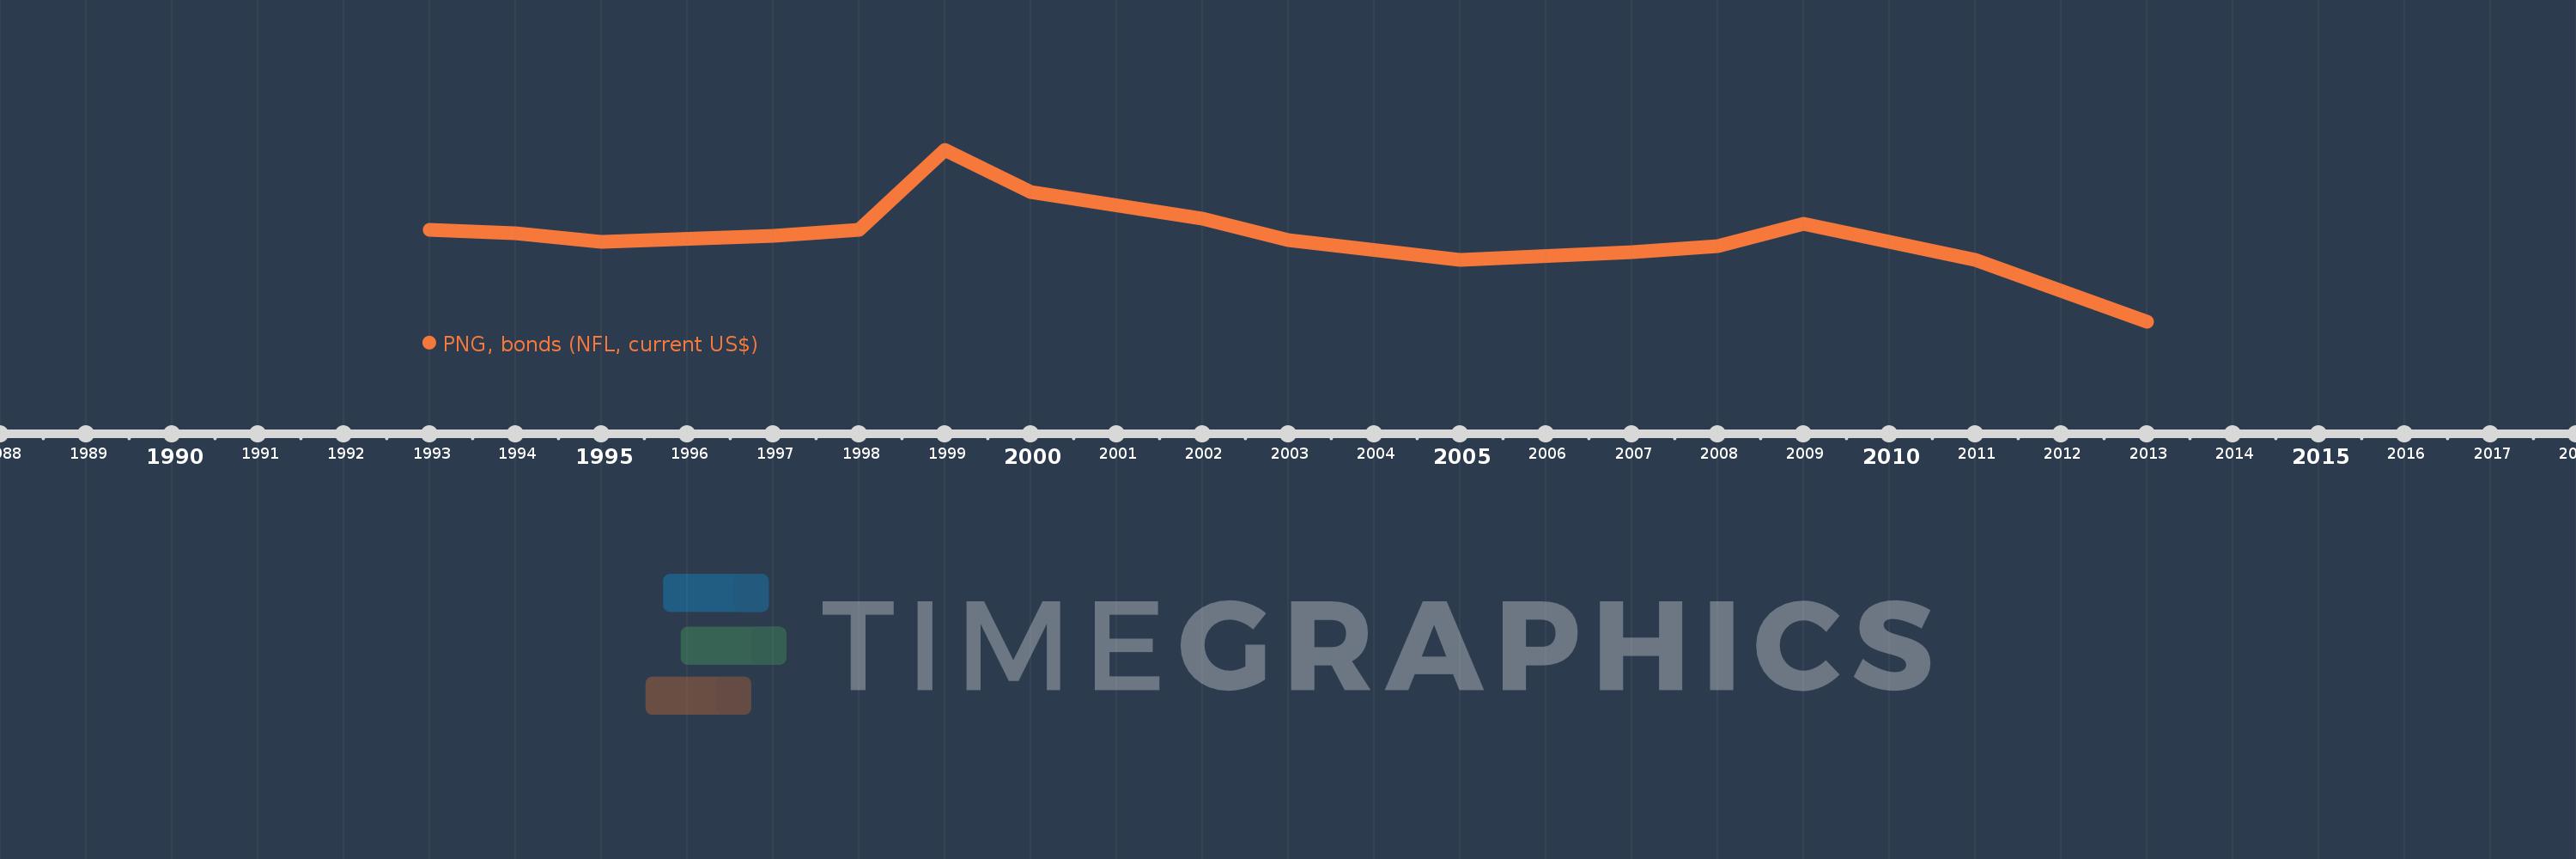
PNG, bonds (NFL, current US$)
2013,2011,2009,2008,2007,2005,2003,2002,2000,1999,1998,1997,1995,1994,1993
This statistics in other country:
Timeline:
This timeline shows a graph from 1993 to 2013 of Venezuela, RB. No data until 1992. Number of actual observations by date: 15.
Source name:
World Development Indicators
Source organization:
World Bank, International Debt Statistics.
Categories, topics:
External Debt
Last updated:
apr 23, 2017
Indicators value changes by year
Minimum:
-2.365 bln
jan 1, 2013
Maximum:
2.375 bln
jan 1, 1999
At the date of observation
Value
Absolute change
Change from previous value
jan 1, 1993
174.0 mln
+174.0 mln
0.0%
jan 1, 1994
90.0 mln
-84.0 mln
-48.28%
jan 1, 1995
-150.0 mln
-240.0 mln
-266.67%
jan 1, 1997
20.0 mln
+170.0 mln
-113.33%
jan 1, 1998
185.0 mln
+165.0 mln
825.0%
jan 1, 1999
2.375 bln
+2.19 bln
1.18K%
jan 1, 2000
1.213 bln
-1.162 bln
-48.91%
jan 1, 2002
480.0 mln
-733.363 mln
-60.44%
jan 1, 2003
-100.0 mln
-580.0 mln
-120.83%
jan 1, 2005
-640.0 mln
-540.0 mln
540.0%
jan 1, 2007
-446.052 mln
+193.948 mln
-30.3%
jan 1, 2008
-274.0 mln
+172.052 mln
-38.57%
jan 1, 2009
350.0 mln
+624.0 mln
-227.74%
jan 1, 2011
-659.052 mln
-1.009 bln
-288.3%
jan 1, 2013
-2.365 bln
-1.706 bln
258.89%
Ranking of countries by current statistics by years


Comments: