29
/
en
AIzaSyAYiBZKx7MnpbEhh9jyipgxe19OcubqV5w
April 1, 2024
246095
South Africa
ZAF
true
2
1
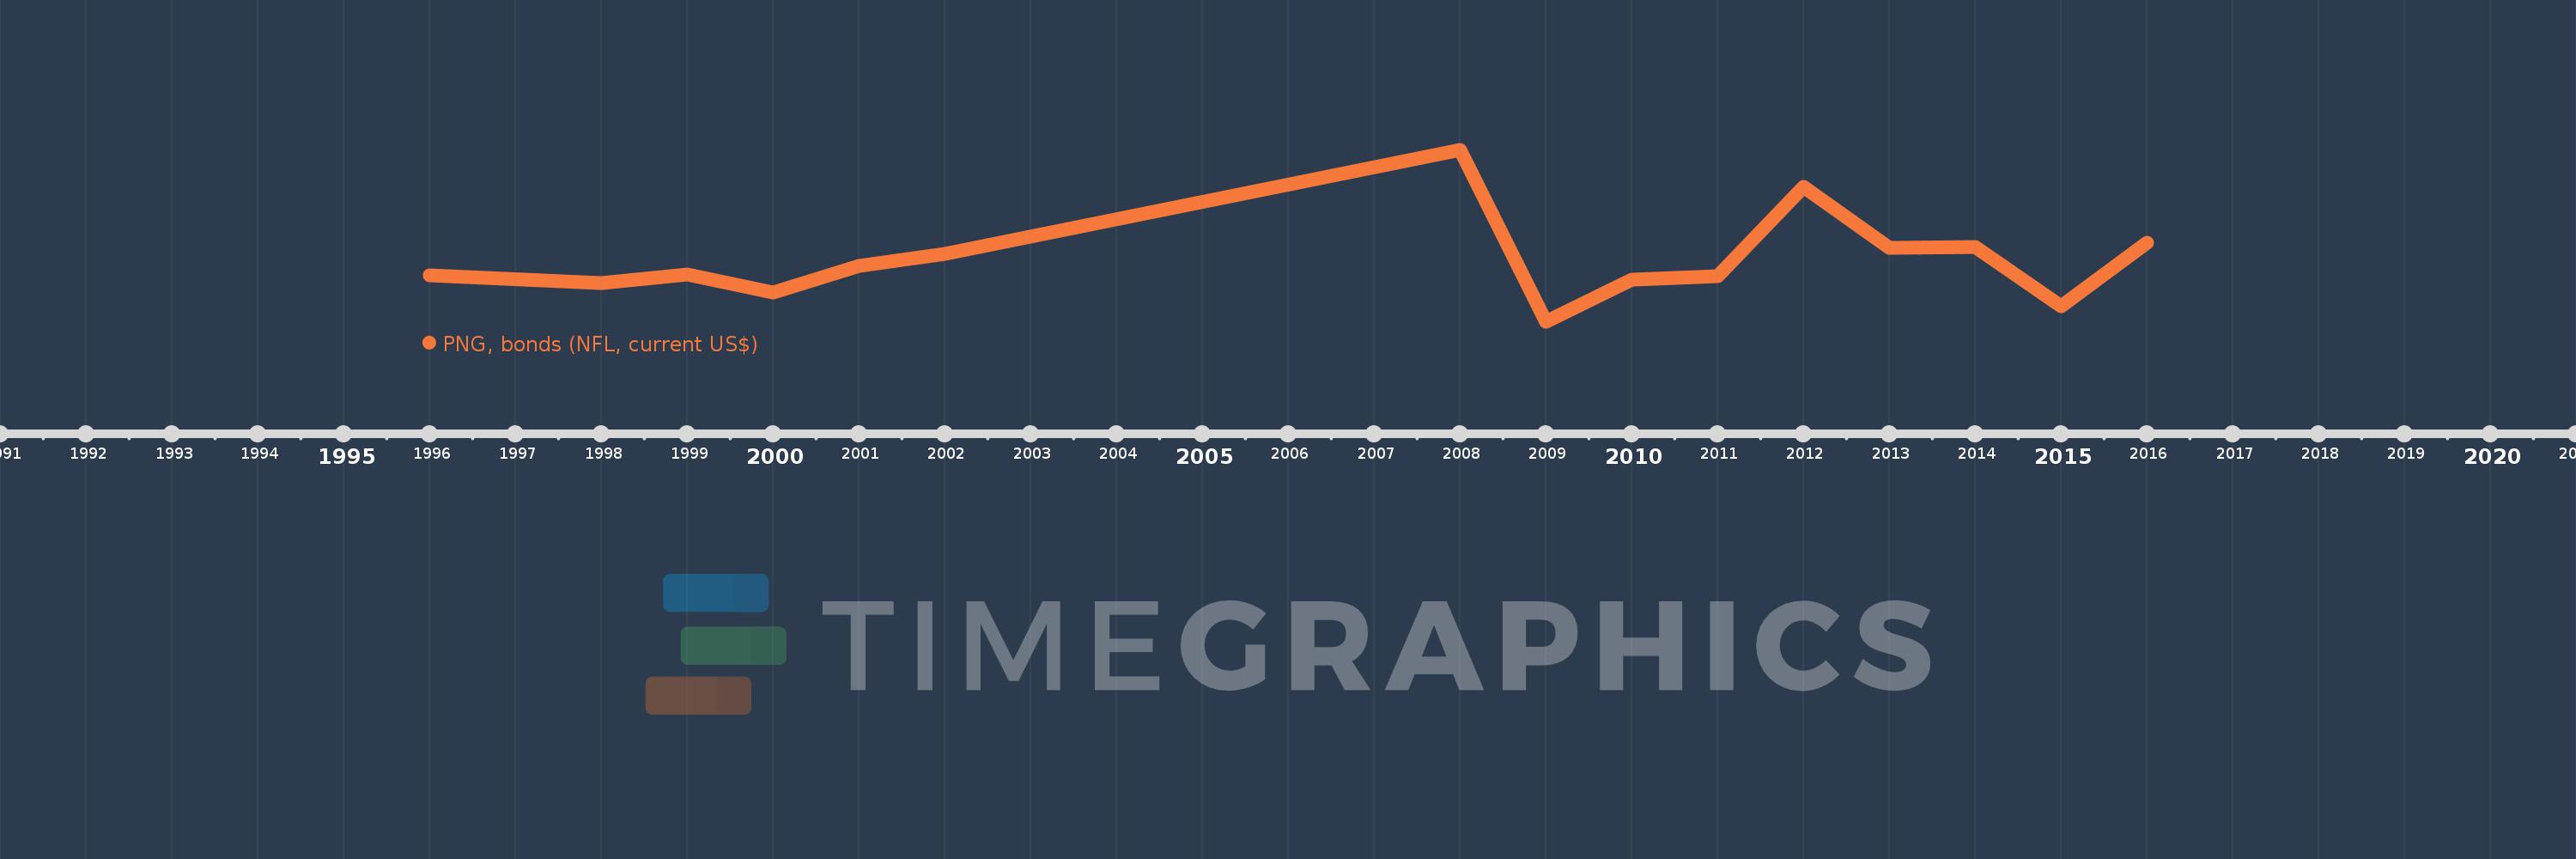
PNG, bonds (NFL, current US$)
2016,2015,2014,2013,2012,2011,2010,2009,2008,2002,2001,2000,1999,1998,1996
This statistics in other country:
Timeline:
This timeline shows a graph from 1996 to 2016 of South Africa. No data until 1995. Number of actual observations by date: 15.
Source name:
World Development Indicators
Source organization:
World Bank, International Debt Statistics.
Categories, topics:
External Debt
Last updated:
apr 23, 2017
Indicators value changes by year
Minimum:
-1.513 bln
jan 1, 2009
Maximum:
5.3 bln
jan 1, 2008
At the date of observation
Value
Absolute change
Change from previous value
jan 1, 1996
350.0 mln
+350.0 mln
0.0%
jan 1, 1998
45.0 mln
-305.0 mln
-87.14%
jan 1, 1999
373.047 mln
+328.047 mln
728.99%
jan 1, 2000
-357.75 mln
-730.797 mln
-195.9%
jan 1, 2001
712.011 mln
+1.07 bln
-299.02%
jan 1, 2002
1.205 bln
+492.989 mln
69.24%
jan 1, 2008
5.3 bln
+4.095 bln
339.83%
jan 1, 2009
-1.513 bln
-6.813 bln
-128.55%
jan 1, 2010
163.0 mln
+1.676 bln
-110.77%
jan 1, 2011
301.0 mln
+138.0 mln
84.66%
jan 1, 2012
3.852 bln
+3.551 bln
1.18K%
jan 1, 2013
1.431 bln
-2.421 bln
-62.85%
jan 1, 2014
1.459 bln
+28.213 mln
1.97%
jan 1, 2015
-894.958 mln
-2.354 bln
-161.33%
jan 1, 2016
1.62 bln
+2.515 bln
-280.99%
Ranking of countries by current statistics by years


Comments: