29
/
en
AIzaSyAYiBZKx7MnpbEhh9jyipgxe19OcubqV5w
April 1, 2024
218836
Panama
PAN
true
2
1
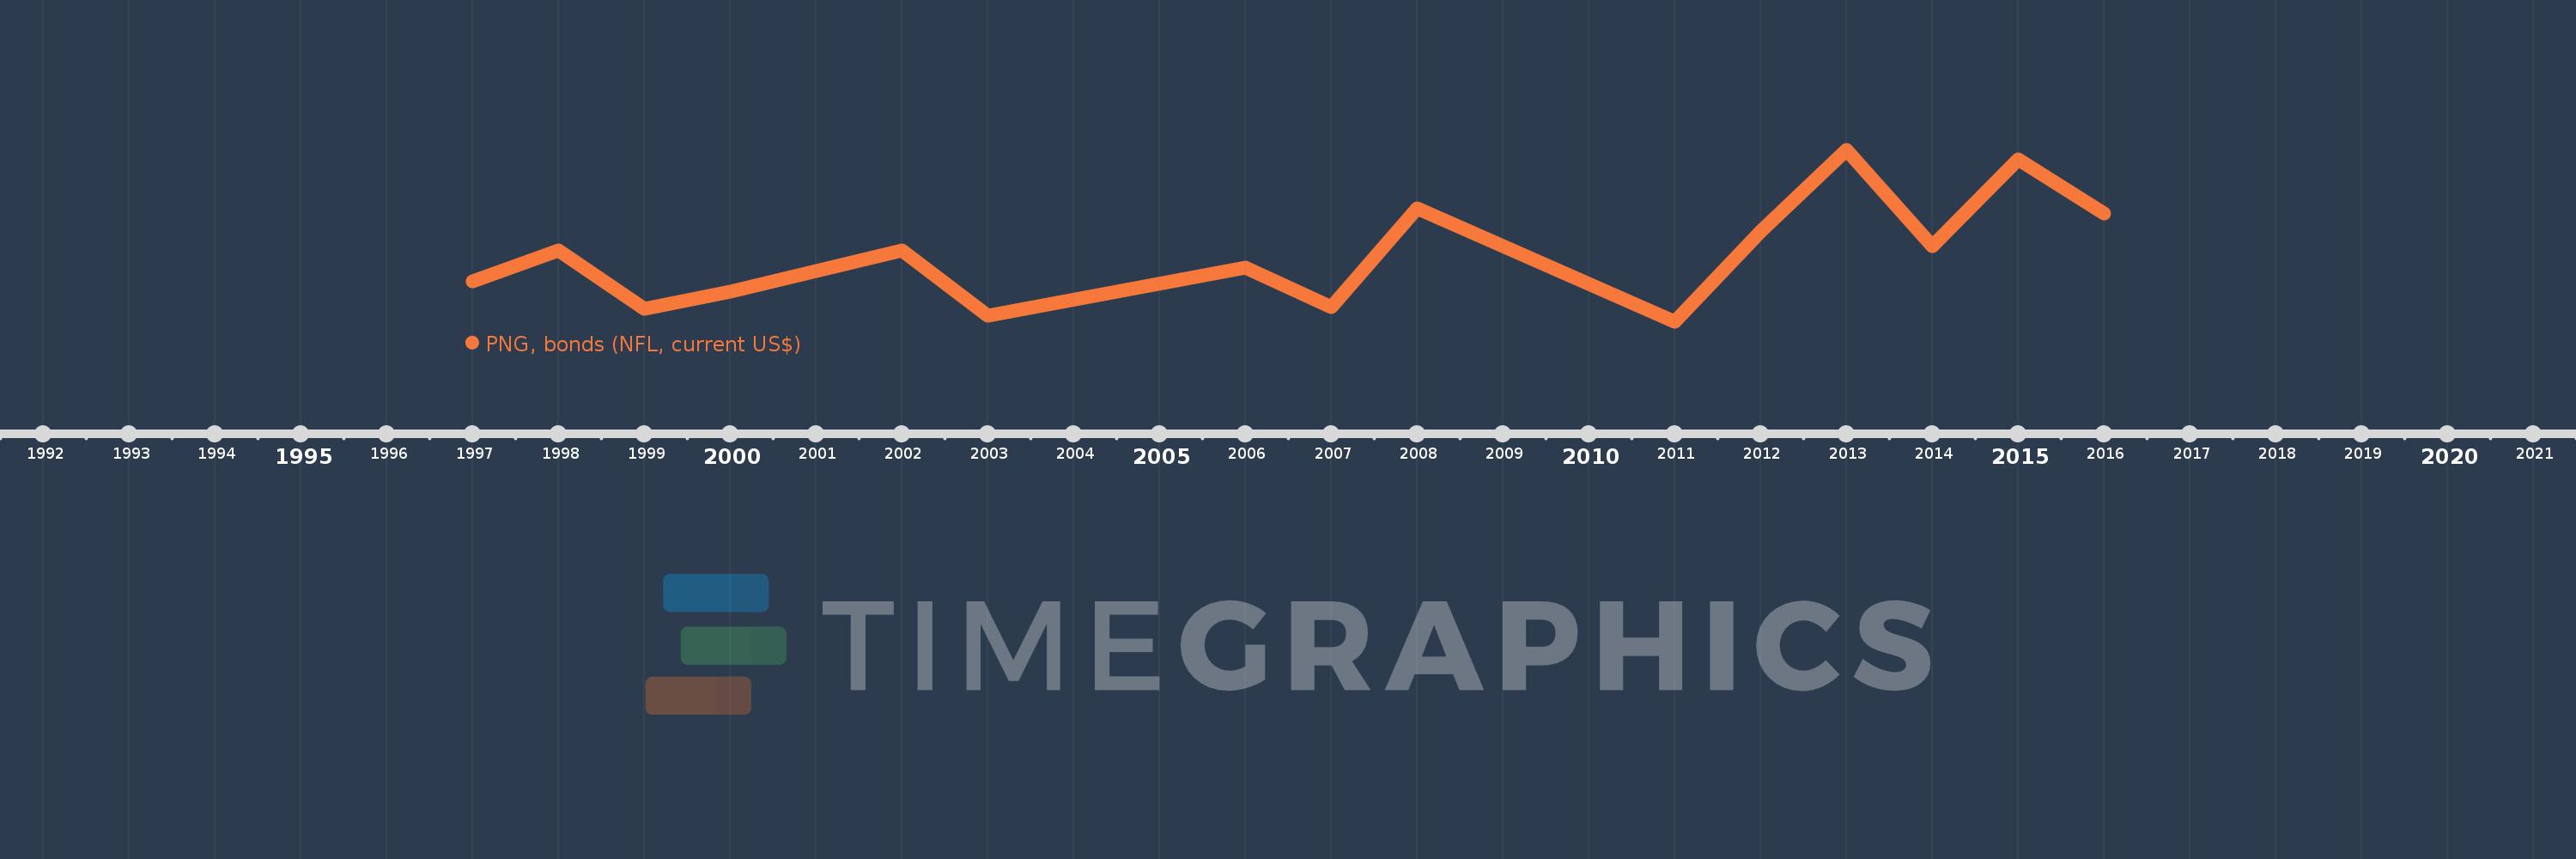
PNG, bonds (NFL, current US$)
2016,2015,2014,2013,2012,2011,2008,2007,2006,2003,2002,2000,1999,1998,1997
This statistics in other country:
Timeline:
This timeline shows a graph from 1997 to 2016 of Panama. No data until 1996. Number of actual observations by date: 15.
Source name:
World Development Indicators
Source organization:
World Bank, International Debt Statistics.
Categories, topics:
External Debt
Last updated:
apr 23, 2017
Indicators value changes by year
Minimum:
-150.0 mln
jan 1, 2011
Maximum:
800.0 mln
jan 1, 2013
At the date of observation
Value
Absolute change
Change from previous value
jan 1, 1997
75.0 mln
+75.0 mln
0.0%
jan 1, 1998
246.0 mln
+171.0 mln
228.0%
jan 1, 1999
-75.0 mln
-321.0 mln
-130.49%
jan 1, 2000
20.0 mln
+95.0 mln
-126.67%
jan 1, 2002
246.745 mln
+226.745 mln
1.13K%
jan 1, 2003
-115.0 mln
-361.745 mln
-146.61%
jan 1, 2006
150.0 mln
+265.0 mln
-230.43%
jan 1, 2007
-69.078 mln
-219.078 mln
-146.05%
jan 1, 2008
479.989 mln
+549.067 mln
-794.85%
jan 1, 2011
-150.0 mln
-629.989 mln
-131.25%
jan 1, 2012
350.0 mln
+500.0 mln
-333.33%
jan 1, 2013
800.0 mln
+450.0 mln
128.57%
jan 1, 2014
270.0 mln
-530.0 mln
-66.25%
jan 1, 2015
748.766 mln
+478.766 mln
177.32%
jan 1, 2016
450.0 mln
-298.766 mln
-39.9%
Ranking of countries by current statistics by years


Comments: