29
/
en
AIzaSyAYiBZKx7MnpbEhh9jyipgxe19OcubqV5w
April 1, 2024
230227
Russian Federation
RUS
true
2
1
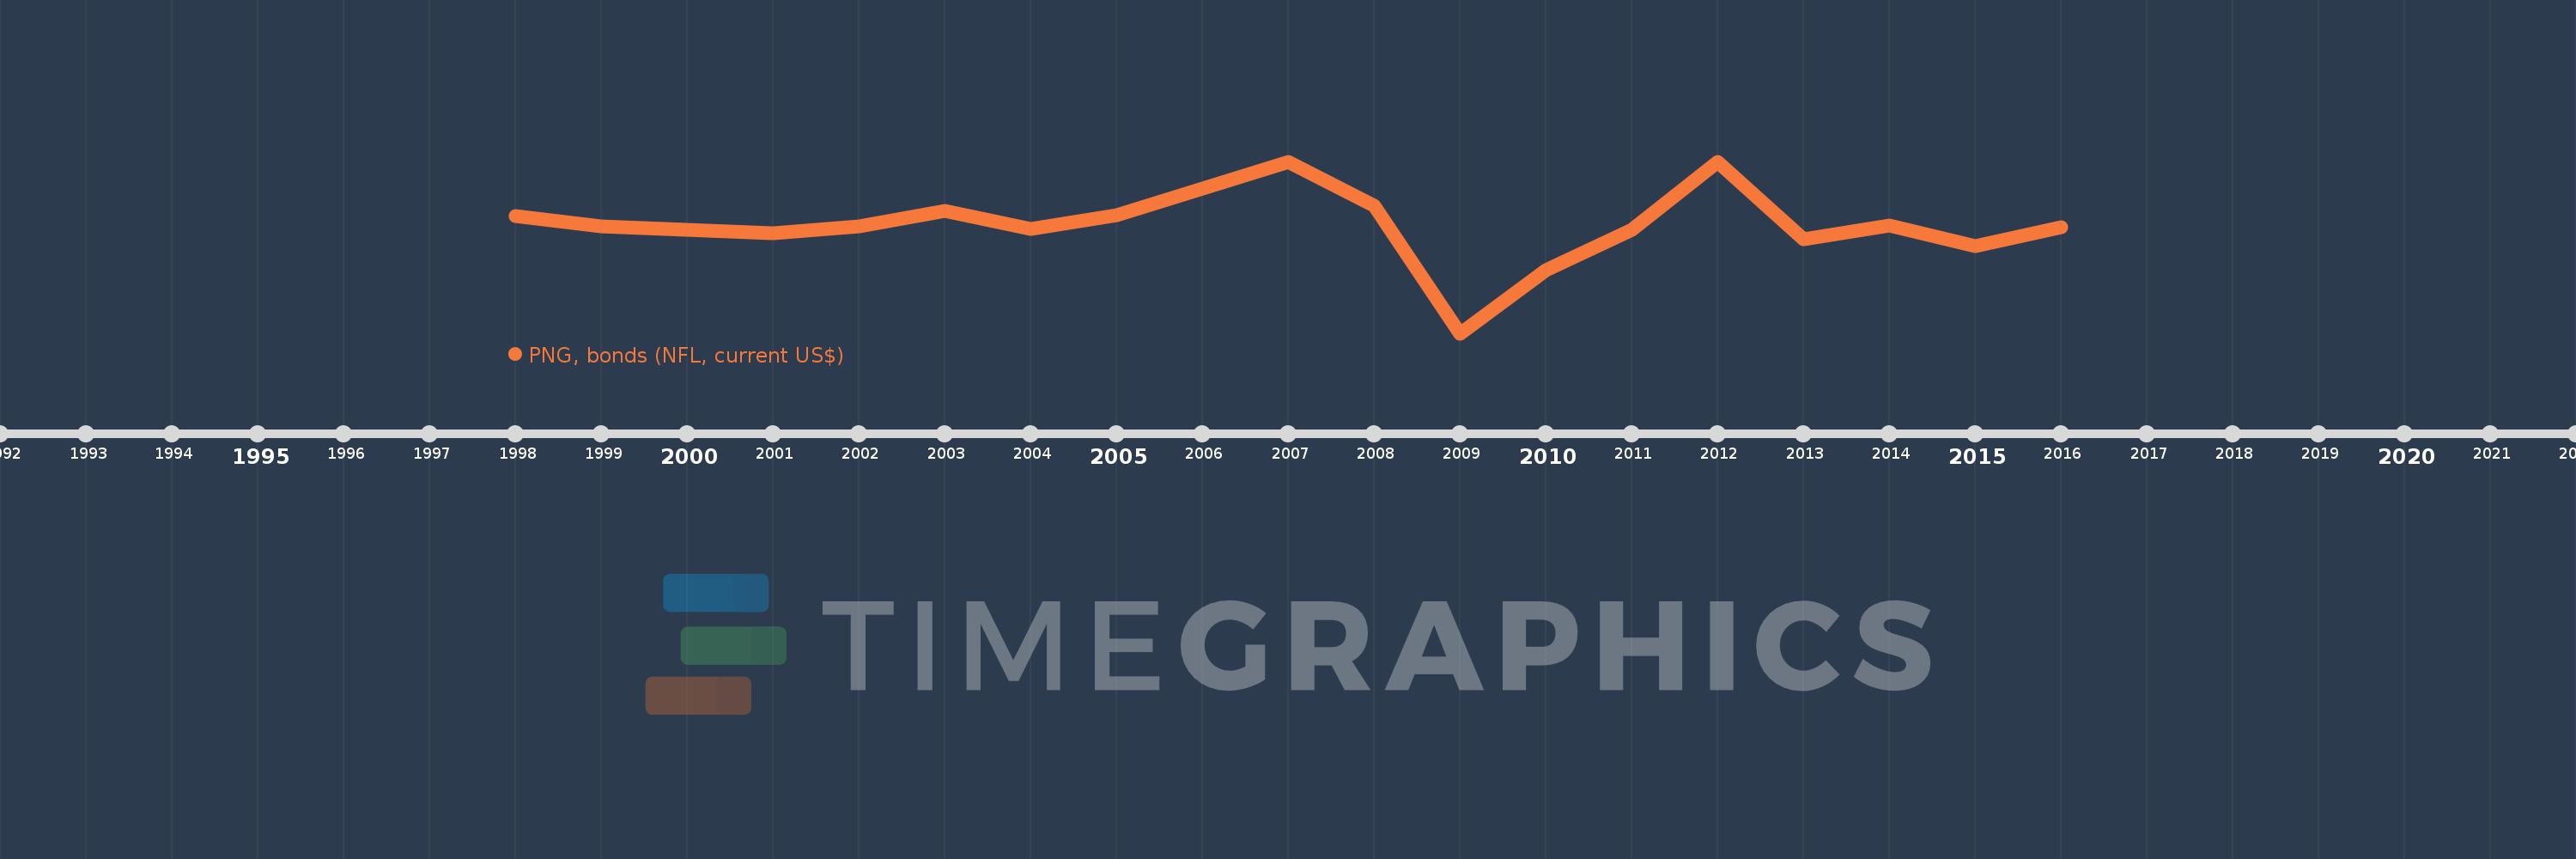
PNG, bonds (NFL, current US$)
2016,2015,2014,2013,2012,2011,2010,2009,2008,2007,2006,2005,2004,2003,2002,2001,1999,1998
This statistics in other country:
Timeline:
This timeline shows a graph from 1998 to 2016 of Russian Federation. No data until 1997. Number of actual observations by date: 18.
Source name:
World Development Indicators
Source organization:
World Bank, International Debt Statistics.
Categories, topics:
External Debt
Last updated:
apr 23, 2017
Indicators value changes by year
Minimum:
-16.846 bln
jan 1, 2009
Maximum:
10.692 bln
jan 1, 2012
At the date of observation
Value
Absolute change
Change from previous value
jan 1, 1998
1.905 bln
+1.905 bln
0.0%
jan 1, 1999
278.049 mln
-1.627 bln
-85.4%
jan 1, 2001
-750.0 mln
-1.028 bln
-369.74%
jan 1, 2002
321.003 mln
+1.071 bln
-142.8%
jan 1, 2003
2.763 bln
+2.442 bln
760.7%
jan 1, 2004
-58.213 mln
-2.821 bln
-102.11%
jan 1, 2005
2.085 bln
+2.143 bln
-3.68K%
jan 1, 2006
6.404 bln
+4.319 bln
207.17%
jan 1, 2007
10.565 bln
+4.161 bln
64.97%
jan 1, 2008
3.645 bln
-6.92 bln
-65.5%
jan 1, 2009
-16.846 bln
-20.491 bln
-562.19%
jan 1, 2010
-6.747 bln
+10.099 bln
-59.95%
jan 1, 2011
-185.859 mln
+6.561 bln
-97.25%
jan 1, 2012
10.692 bln
+10.878 bln
-5.85K%
jan 1, 2013
-1.7 bln
-12.392 bln
-115.9%
jan 1, 2014
499.737 mln
+2.2 bln
-129.39%
jan 1, 2015
-2.915 bln
-3.415 bln
-683.29%
jan 1, 2016
146.788 mln
+3.062 bln
-105.04%
Ranking of countries by current statistics by years


Comments: