29
/
en
AIzaSyAYiBZKx7MnpbEhh9jyipgxe19OcubqV5w
April 1, 2024
54697
Post-demographic dividend
PST
false
2
1
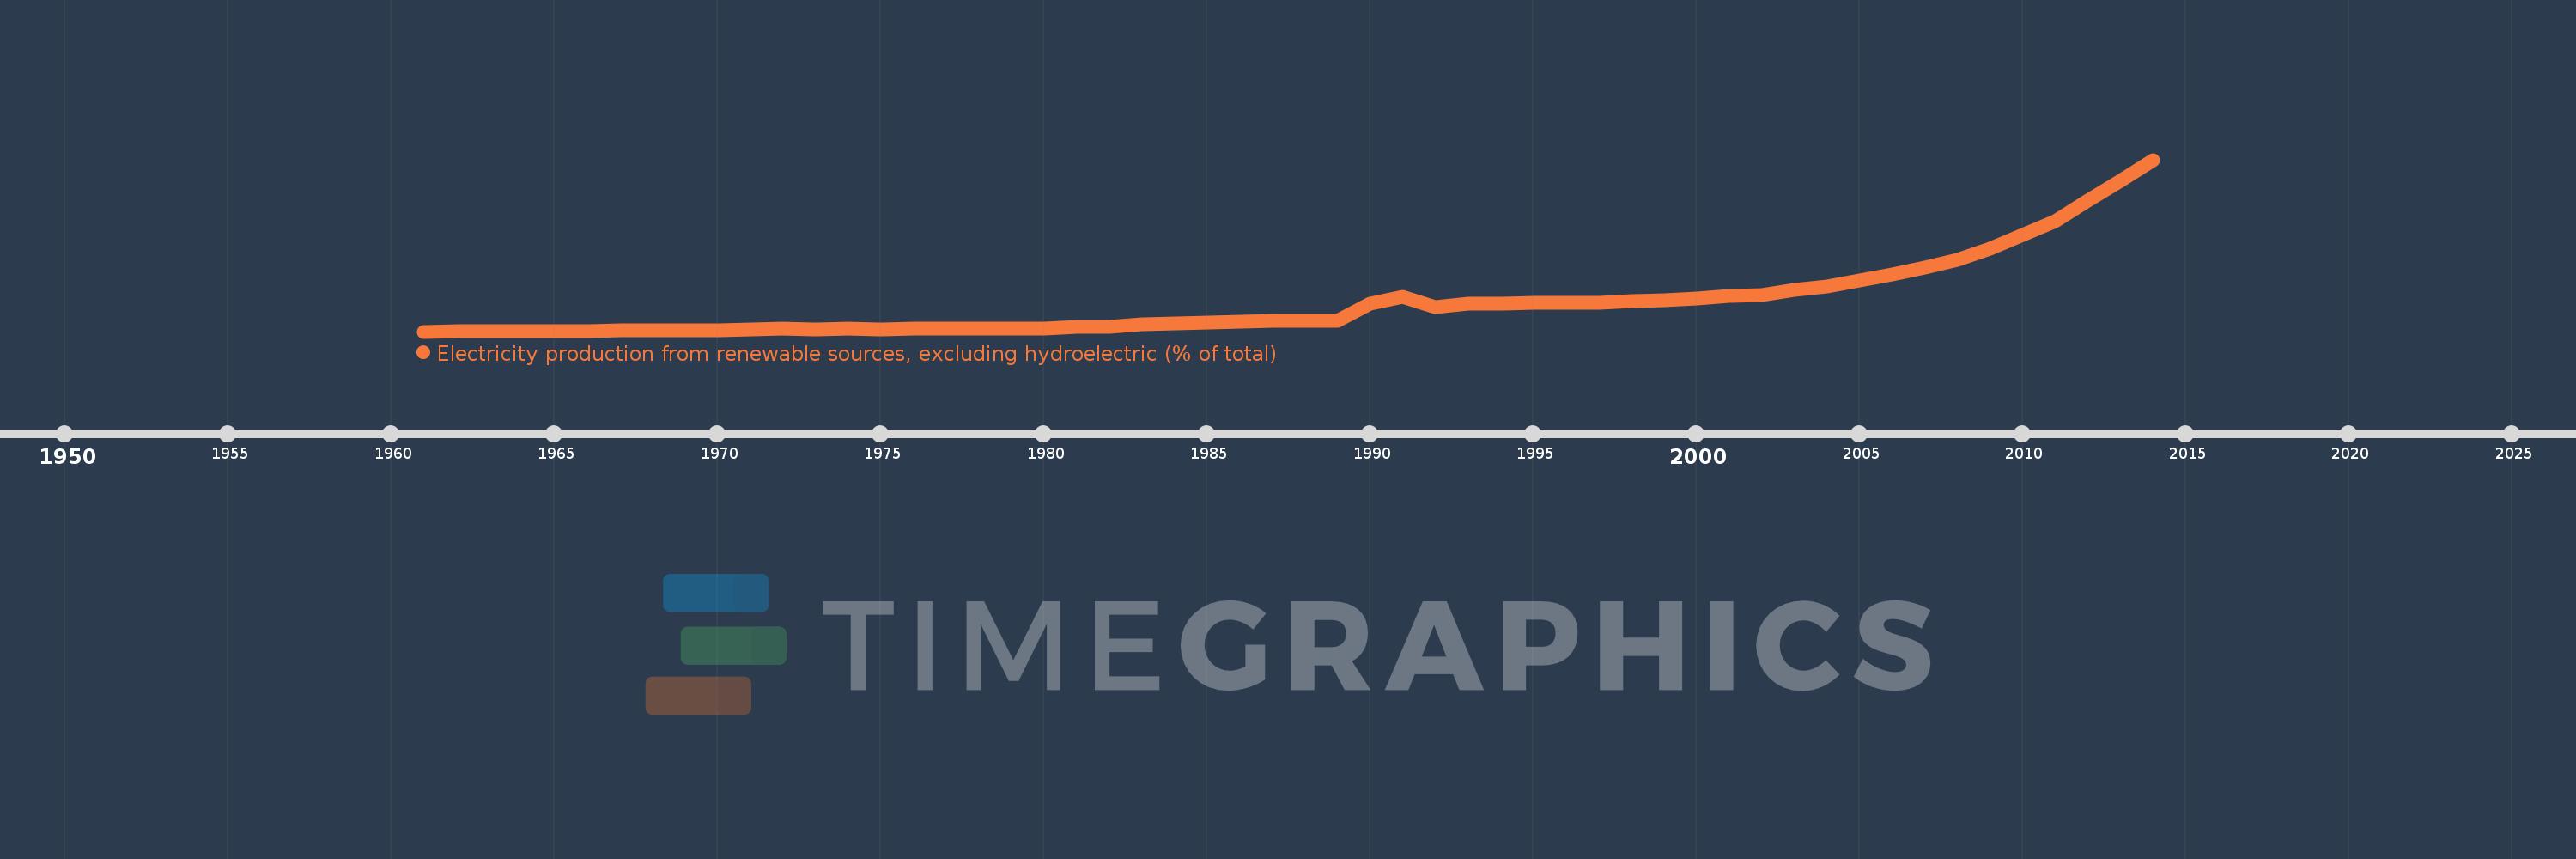
Electricity production from renewable sources, excluding hydroelectric (% of total)
2014,2013,2012,2011,2010,2009,2008,2007,2006,2005,2004,2003,2002,2001,2000,1999,1998,1997,1996,1995,1994,1993,1992,1991,1990,1989,1988,1987,1986,1985,1984,1983,1982,1981,1980,1979,1978,1977,1976,1975,1974,1973,1972,1971,1970,1969,1968,1967,1966,1965,1964,1963,1962,1961
This statistics in other country:
AlbaniaAlgeriaAngolaArab WorldArgentinaArmeniaAustraliaAustriaAzerbaijanBahrainBangladeshBelarusBelgiumBeninBoliviaBosnia and HerzegovinaBotswanaBrazilBrunei DarussalamBulgariaCambodiaCameroonCanadaCentral Europe and the BalticsChileChinaColombiaCongo, Dem. Rep.Congo, Rep.Costa RicaCote d'IvoireCroatiaCubaCuracaoCyprusCzech RepublicDenmarkDominican RepublicEarly-demographic dividendEast Asia & PacificEast Asia & Pacific (excluding high income)East Asia & Pacific (IDA & IBRD countries)EcuadorEgypt, Arab Rep.El SalvadorEritreaEstoniaEthiopiaEuro areaEurope & Central AsiaEurope & Central Asia (excluding high income)Europe & Central Asia (IDA & IBRD countries)European UnionFinlandFragile and conflict affected situationsFranceGabonGeorgiaGermanyGhanaGibraltarGreeceGuatemalaHaitiHeavily indebted poor countries (HIPC)High incomeHondurasHong Kong SAR, ChinaHungaryIBRD onlyIcelandIDA & IBRD totalIDA blendIDA onlyIDA totalIndiaIndonesiaIran, Islamic Rep.IraqIrelandIsraelItalyJamaicaJapanJordanKazakhstanKenyaKorea, Dem. People’s Rep.Korea, Rep.KosovoKuwaitKyrgyz RepublicLate-demographic dividendLatin America & Caribbean Latin America & Caribbean (excluding high income)Latin America & the Caribbean (IDA & IBRD countries)LatviaLeast developed countries: UN classificationLebanonLibyaLithuaniaLow & middle incomeLower middle incomeLuxembourgMacedonia, FYRMalaysiaMaltaMauritiusMexicoMiddle East & North AfricaMiddle East & North Africa (excluding high income)Middle East & North Africa (IDA & IBRD countries)Middle incomeMoldovaMongoliaMontenegroMoroccoMozambiqueMyanmarNamibiaNepalNetherlandsNew ZealandNicaraguaNigerNigeriaNorth AmericaNorwayOECD membersOmanOther small statesPakistanPanamaParaguayPeruPhilippinesPolandPortugalPost-demographic dividendPre-demographic dividendQatarRomaniaRussian FederationSaudi ArabiaSenegalSerbiaSingaporeSlovak RepublicSloveniaSmall statesSouth AfricaSouth AsiaSouth Asia (IDA & IBRD)South SudanSpainSri LankaSub-Saharan Africa Sub-Saharan Africa (excluding high income)Sub-Saharan Africa (IDA & IBRD countries)SudanSwedenSwitzerlandSyrian Arab RepublicTajikistanTanzaniaThailandTogoTrinidad and TobagoTunisiaTurkeyTurkmenistanUkraineUnited Arab EmiratesUnited KingdomUnited StatesUpper middle incomeUruguayUzbekistanVenezuela, RBVietnamWorldYemen, Rep.ZambiaZimbabwe Timeline:
This timeline shows a graph from 1961 to 2014 of Post-demographic dividend. No data until 1960. Number of actual observations by date: 54.
Source name:
World Development Indicators
Source organization:
IEA Statistics © OECD/IEA 2014 (http://www.iea.org/stats/index.asp), subject to https://www.iea.org/t&c/termsandconditions/
Categories, topics:
Energy & Mining, Climate Change, Environment
Last updated:
apr 23, 2017
Indicators value changes by year
At the date of observation
Value
Absolute change
Change from previous value
jan 1, 1961
0.17
+0.17
0.0%
jan 1, 1962
0.181
+0.011
6.32%
jan 1, 1963
0.186
+0.005
2.98%
jan 1, 1964
0.198
+0.012
6.44%
jan 1, 1965
0.194
-0.004
-2.01%
jan 1, 1966
0.194
+0.0
0.03%
jan 1, 1967
0.221
+0.027
13.68%
jan 1, 1968
0.215
-0.006
-2.74%
jan 1, 1969
0.223
+0.008
3.72%
jan 1, 1970
0.222
-0.001
-0.49%
jan 1, 1971
0.278
+0.057
25.65%
jan 1, 1972
0.291
+0.013
4.65%
jan 1, 1973
0.283
-0.008
-2.71%
jan 1, 1974
0.302
+0.019
6.7%
jan 1, 1975
0.275
-0.028
-9.14%
jan 1, 1976
0.3
+0.026
9.29%
jan 1, 1977
0.307
+0.007
2.36%
jan 1, 1978
0.311
+0.004
1.25%
jan 1, 1979
0.303
-0.008
-2.63%
jan 1, 1980
0.325
+0.022
7.31%
jan 1, 1981
0.375
+0.05
15.27%
jan 1, 1982
0.397
+0.022
5.97%
jan 1, 1983
0.522
+0.125
31.43%
jan 1, 1984
0.549
+0.027
5.14%
jan 1, 1985
0.587
+0.038
6.89%
jan 1, 1986
0.624
+0.038
6.4%
jan 1, 1987
0.668
+0.043
6.94%
jan 1, 1988
0.675
+0.007
1.04%
jan 1, 1989
0.681
+0.006
0.9%
jan 1, 1990
1.456
+0.775
113.87%
jan 1, 1991
1.762
+0.306
21.03%
jan 1, 1992
1.315
-0.447
-25.37%
jan 1, 1993
1.444
+0.129
9.8%
jan 1, 1994
1.478
+0.034
2.38%
jan 1, 1995
1.516
+0.038
2.54%
jan 1, 1996
1.493
-0.022
-1.47%
jan 1, 1997
1.505
+0.012
0.78%
jan 1, 1998
1.57
+0.065
4.35%
jan 1, 1999
1.618
+0.048
3.05%
jan 1, 2000
1.704
+0.086
5.29%
jan 1, 2001
1.807
+0.103
6.07%
jan 1, 2002
1.856
+0.048
2.66%
jan 1, 2003
2.077
+0.221
11.93%
jan 1, 2004
2.256
+0.179
8.62%
jan 1, 2005
2.522
+0.266
11.77%
jan 1, 2006
2.82
+0.299
11.85%
jan 1, 2007
3.13
+0.309
10.97%
jan 1, 2008
3.5
+0.37
11.83%
jan 1, 2009
3.984
+0.484
13.82%
jan 1, 2010
4.645
+0.661
16.6%
jan 1, 2011
5.282
+0.637
13.71%
jan 1, 2012
6.233
+0.952
18.02%
jan 1, 2013
7.136
+0.902
14.48%
jan 1, 2014
8.11
+0.974
13.65%
Ranking of countries by current statistics by years


Comments: