29
/
en
AIzaSyAYiBZKx7MnpbEhh9jyipgxe19OcubqV5w
April 1, 2024
51776
North America
NAC
false
2
1
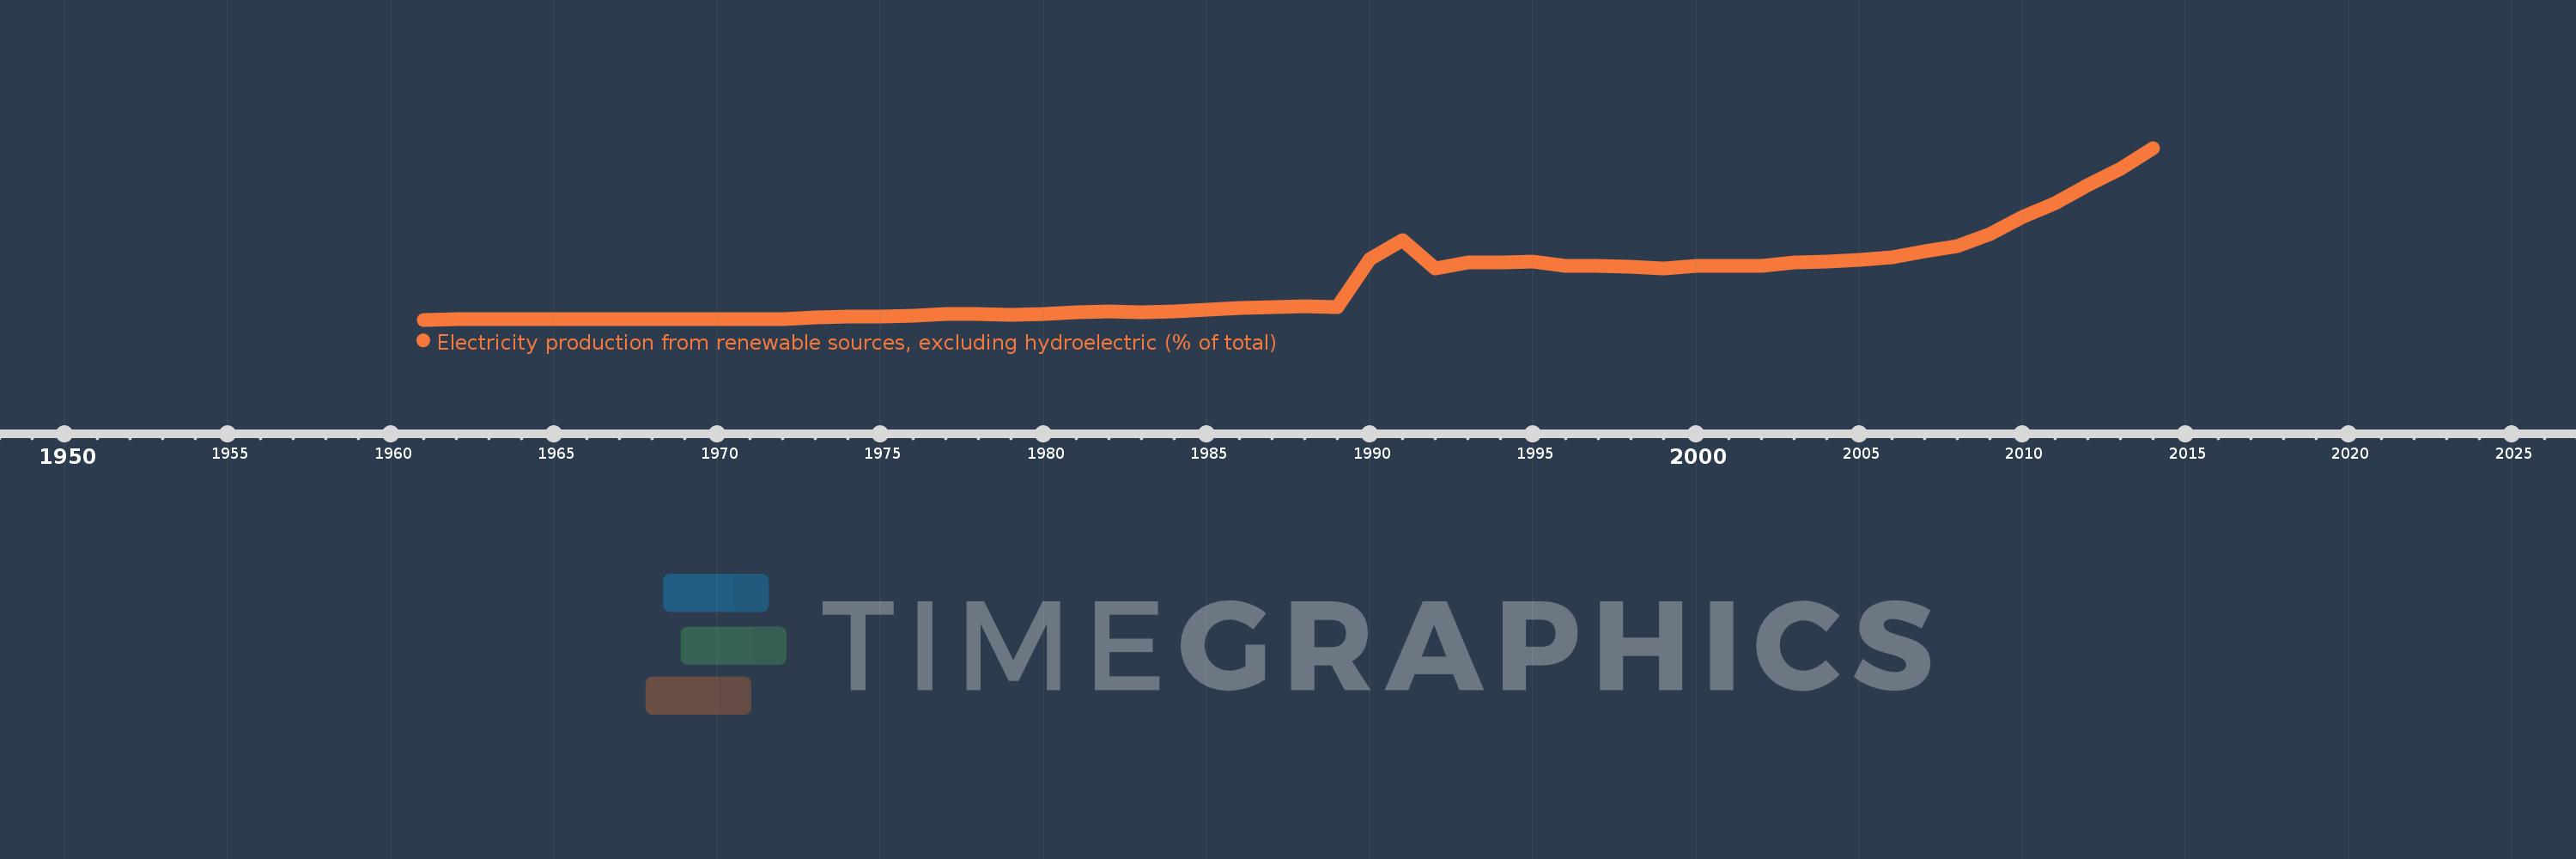
Electricity production from renewable sources, excluding hydroelectric (% of total)
2014,2013,2012,2011,2010,2009,2008,2007,2006,2005,2004,2003,2002,2001,2000,1999,1998,1997,1996,1995,1994,1993,1992,1991,1990,1989,1988,1987,1986,1985,1984,1983,1982,1981,1980,1979,1978,1977,1976,1975,1974,1973,1972,1971,1970,1969,1968,1967,1966,1965,1964,1963,1962,1961
This statistics in other country:
AlbaniaAlgeriaAngolaArab WorldArgentinaArmeniaAustraliaAustriaAzerbaijanBahrainBangladeshBelarusBelgiumBeninBoliviaBosnia and HerzegovinaBotswanaBrazilBrunei DarussalamBulgariaCambodiaCameroonCanadaCentral Europe and the BalticsChileChinaColombiaCongo, Dem. Rep.Congo, Rep.Costa RicaCote d'IvoireCroatiaCubaCuracaoCyprusCzech RepublicDenmarkDominican RepublicEarly-demographic dividendEast Asia & PacificEast Asia & Pacific (excluding high income)East Asia & Pacific (IDA & IBRD countries)EcuadorEgypt, Arab Rep.El SalvadorEritreaEstoniaEthiopiaEuro areaEurope & Central AsiaEurope & Central Asia (excluding high income)Europe & Central Asia (IDA & IBRD countries)European UnionFinlandFragile and conflict affected situationsFranceGabonGeorgiaGermanyGhanaGibraltarGreeceGuatemalaHaitiHeavily indebted poor countries (HIPC)High incomeHondurasHong Kong SAR, ChinaHungaryIBRD onlyIcelandIDA & IBRD totalIDA blendIDA onlyIDA totalIndiaIndonesiaIran, Islamic Rep.IraqIrelandIsraelItalyJamaicaJapanJordanKazakhstanKenyaKorea, Dem. People’s Rep.Korea, Rep.KosovoKuwaitKyrgyz RepublicLate-demographic dividendLatin America & Caribbean Latin America & Caribbean (excluding high income)Latin America & the Caribbean (IDA & IBRD countries)LatviaLeast developed countries: UN classificationLebanonLibyaLithuaniaLow & middle incomeLower middle incomeLuxembourgMacedonia, FYRMalaysiaMaltaMauritiusMexicoMiddle East & North AfricaMiddle East & North Africa (excluding high income)Middle East & North Africa (IDA & IBRD countries)Middle incomeMoldovaMongoliaMontenegroMoroccoMozambiqueMyanmarNamibiaNepalNetherlandsNew ZealandNicaraguaNigerNigeriaNorth AmericaNorwayOECD membersOmanOther small statesPakistanPanamaParaguayPeruPhilippinesPolandPortugalPost-demographic dividendPre-demographic dividendQatarRomaniaRussian FederationSaudi ArabiaSenegalSerbiaSingaporeSlovak RepublicSloveniaSmall statesSouth AfricaSouth AsiaSouth Asia (IDA & IBRD)South SudanSpainSri LankaSub-Saharan Africa Sub-Saharan Africa (excluding high income)Sub-Saharan Africa (IDA & IBRD countries)SudanSwedenSwitzerlandSyrian Arab RepublicTajikistanTanzaniaThailandTogoTrinidad and TobagoTunisiaTurkeyTurkmenistanUkraineUnited Arab EmiratesUnited KingdomUnited StatesUpper middle incomeUruguayUzbekistanVenezuela, RBVietnamWorldYemen, Rep.ZambiaZimbabwe Timeline:
This timeline shows a graph from 1961 to 2014 of North America. No data until 1960. Number of actual observations by date: 54.
Source name:
World Development Indicators
Source organization:
IEA Statistics © OECD/IEA 2014 (http://www.iea.org/stats/index.asp), subject to https://www.iea.org/t&c/termsandconditions/
Categories, topics:
Energy & Mining, Climate Change, Environment
Last updated:
apr 23, 2017
Indicators value changes by year
At the date of observation
Value
Absolute change
Change from previous value
jan 1, 1961
0.013
+0.013
0.0%
jan 1, 1962
0.019
+0.006
42.17%
jan 1, 1963
0.02
+0.001
6.27%
jan 1, 1964
0.026
+0.006
29.62%
jan 1, 1965
0.027
+0.001
4.0%
jan 1, 1966
0.027
+0.0
0.48%
jan 1, 1967
0.028
+0.001
2.28%
jan 1, 1968
0.033
+0.005
16.88%
jan 1, 1969
0.04
+0.007
21.51%
jan 1, 1970
0.046
+0.007
17.09%
jan 1, 1971
0.045
-0.002
-3.91%
jan 1, 1972
0.044
-0.001
-1.62%
jan 1, 1973
0.088
+0.044
99.91%
jan 1, 1974
0.123
+0.035
40.26%
jan 1, 1975
0.128
+0.005
3.98%
jan 1, 1976
0.158
+0.031
23.98%
jan 1, 1977
0.197
+0.039
24.44%
jan 1, 1978
0.21
+0.012
6.31%
jan 1, 1979
0.174
-0.036
-16.95%
jan 1, 1980
0.22
+0.046
26.19%
jan 1, 1981
0.254
+0.034
15.54%
jan 1, 1982
0.294
+0.04
15.91%
jan 1, 1983
0.263
-0.032
-10.71%
jan 1, 1984
0.298
+0.035
13.4%
jan 1, 1985
0.352
+0.054
18.14%
jan 1, 1986
0.424
+0.072
20.43%
jan 1, 1987
0.452
+0.029
6.78%
jan 1, 1988
0.477
+0.024
5.39%
jan 1, 1989
0.452
-0.025
-5.25%
jan 1, 1990
2.056
+1.605
355.17%
jan 1, 1991
2.714
+0.658
31.98%
jan 1, 1992
1.751
-0.963
-35.48%
jan 1, 1993
1.964
+0.213
12.15%
jan 1, 1994
1.966
+0.002
0.1%
jan 1, 1995
1.983
+0.017
0.86%
jan 1, 1996
1.843
-0.14
-7.04%
jan 1, 1997
1.842
-0.001
-0.04%
jan 1, 1998
1.81
-0.032
-1.72%
jan 1, 1999
1.759
-0.051
-2.83%
jan 1, 2000
1.838
+0.078
4.45%
jan 1, 2001
1.848
+0.011
0.59%
jan 1, 2002
1.831
-0.017
-0.94%
jan 1, 2003
1.956
+0.125
6.84%
jan 1, 2004
1.974
+0.018
0.91%
jan 1, 2005
2.034
+0.06
3.06%
jan 1, 2006
2.134
+0.099
4.88%
jan 1, 2007
2.342
+0.209
9.78%
jan 1, 2008
2.496
+0.153
6.55%
jan 1, 2009
2.918
+0.423
16.93%
jan 1, 2010
3.506
+0.588
20.15%
jan 1, 2011
3.962
+0.455
12.99%
jan 1, 2012
4.573
+0.612
15.44%
jan 1, 2013
5.121
+0.547
11.97%
jan 1, 2014
5.831
+0.71
13.86%
Ranking of countries by current statistics by years


Comments: