29
/
en
AIzaSyAYiBZKx7MnpbEhh9jyipgxe19OcubqV5w
April 1, 2024
81647
Belgium
BEL
true
2
1
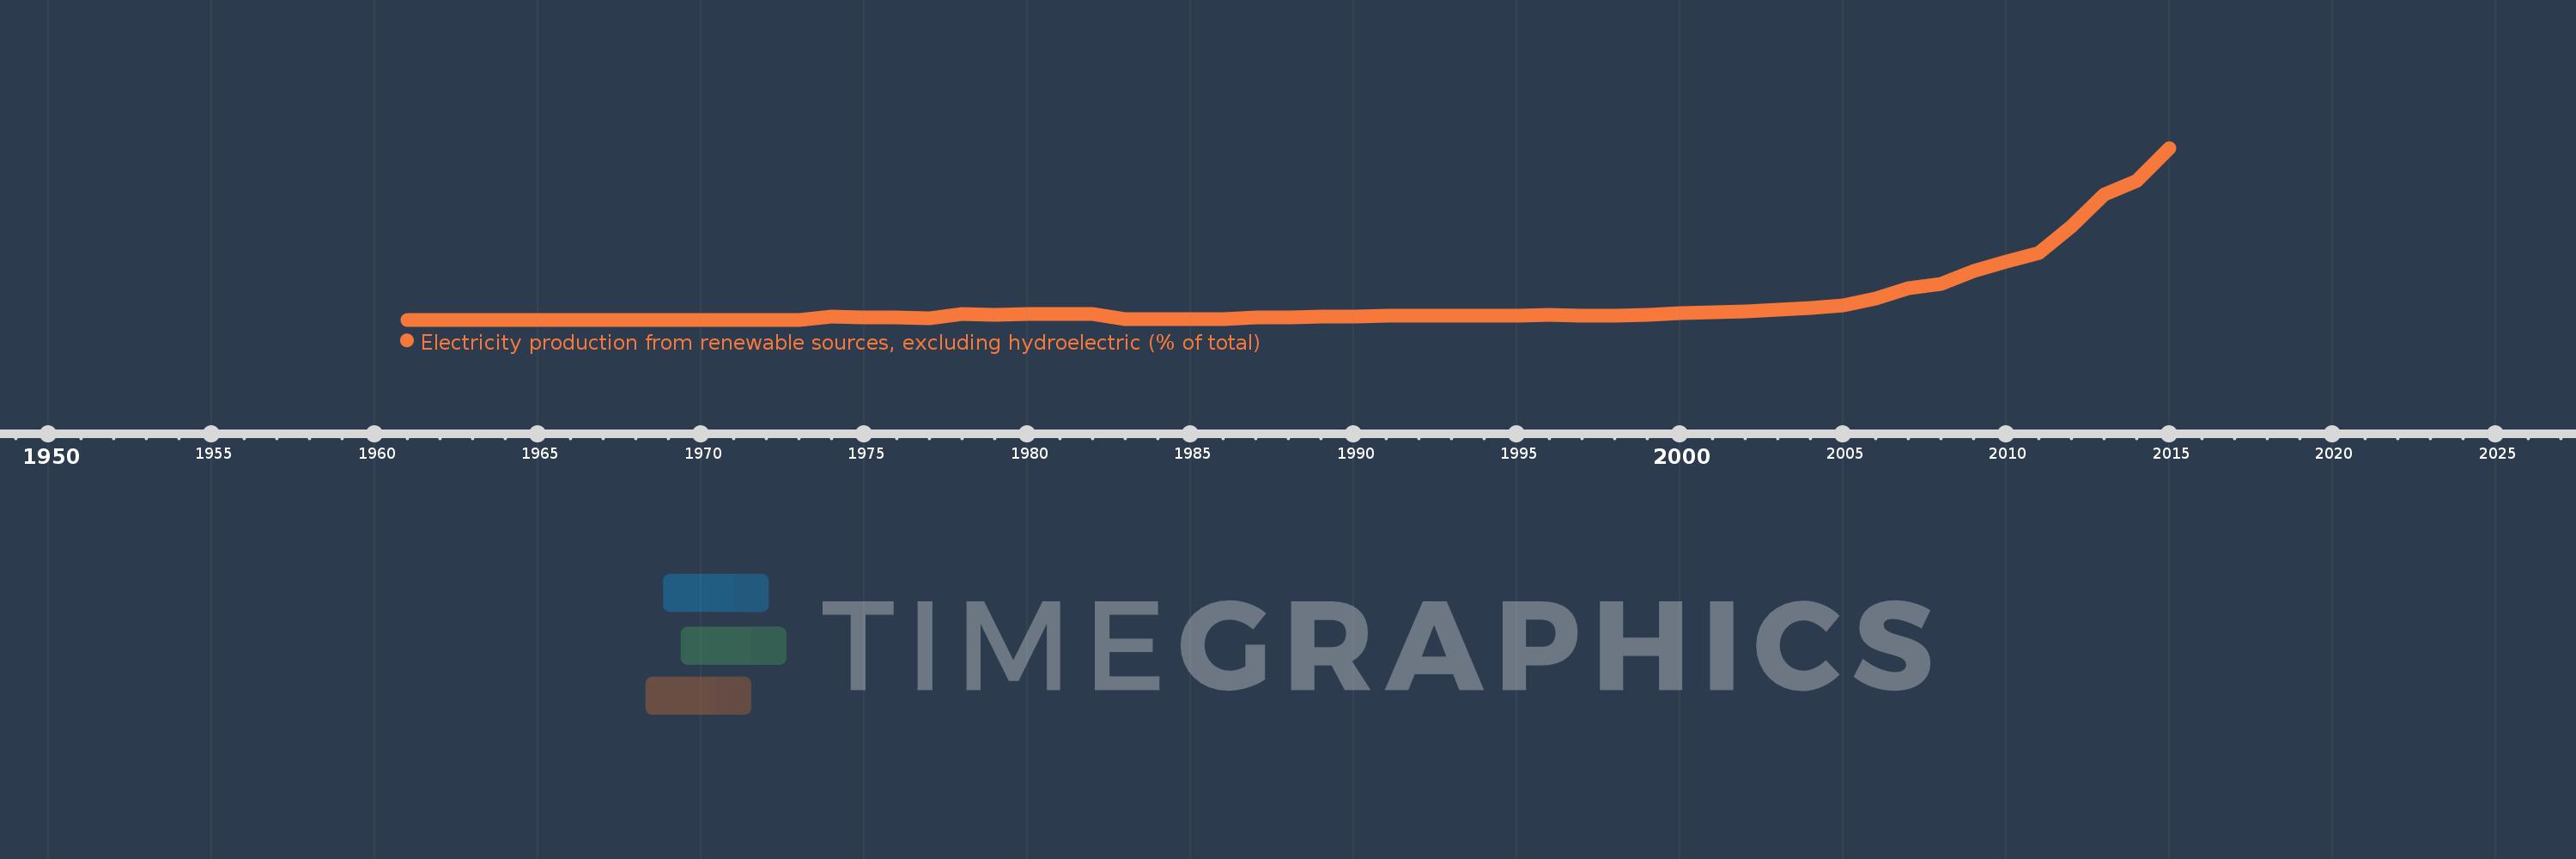
Electricity production from renewable sources, excluding hydroelectric (% of total)
2015,2014,2013,2012,2011,2010,2009,2008,2007,2006,2005,2004,2003,2002,2001,2000,1999,1998,1997,1996,1995,1994,1993,1992,1991,1990,1989,1988,1987,1986,1985,1984,1983,1982,1981,1980,1979,1978,1977,1976,1975,1974,1973,1972,1971,1970,1969,1968,1967,1966,1965,1964,1963,1962,1961
This statistics in other country:
AlbaniaAlgeriaAngolaArab WorldArgentinaArmeniaAustraliaAustriaAzerbaijanBahrainBangladeshBelarusBelgiumBeninBoliviaBosnia and HerzegovinaBotswanaBrazilBrunei DarussalamBulgariaCambodiaCameroonCanadaCentral Europe and the BalticsChileChinaColombiaCongo, Dem. Rep.Congo, Rep.Costa RicaCote d'IvoireCroatiaCubaCuracaoCyprusCzech RepublicDenmarkDominican RepublicEarly-demographic dividendEast Asia & PacificEast Asia & Pacific (excluding high income)East Asia & Pacific (IDA & IBRD countries)EcuadorEgypt, Arab Rep.El SalvadorEritreaEstoniaEthiopiaEuro areaEurope & Central AsiaEurope & Central Asia (excluding high income)Europe & Central Asia (IDA & IBRD countries)European UnionFinlandFragile and conflict affected situationsFranceGabonGeorgiaGermanyGhanaGibraltarGreeceGuatemalaHaitiHeavily indebted poor countries (HIPC)High incomeHondurasHong Kong SAR, ChinaHungaryIBRD onlyIcelandIDA & IBRD totalIDA blendIDA onlyIDA totalIndiaIndonesiaIran, Islamic Rep.IraqIrelandIsraelItalyJamaicaJapanJordanKazakhstanKenyaKorea, Dem. People’s Rep.Korea, Rep.KosovoKuwaitKyrgyz RepublicLate-demographic dividendLatin America & Caribbean Latin America & Caribbean (excluding high income)Latin America & the Caribbean (IDA & IBRD countries)LatviaLeast developed countries: UN classificationLebanonLibyaLithuaniaLow & middle incomeLower middle incomeLuxembourgMacedonia, FYRMalaysiaMaltaMauritiusMexicoMiddle East & North AfricaMiddle East & North Africa (excluding high income)Middle East & North Africa (IDA & IBRD countries)Middle incomeMoldovaMongoliaMontenegroMoroccoMozambiqueMyanmarNamibiaNepalNetherlandsNew ZealandNicaraguaNigerNigeriaNorth AmericaNorwayOECD membersOmanOther small statesPakistanPanamaParaguayPeruPhilippinesPolandPortugalPost-demographic dividendPre-demographic dividendQatarRomaniaRussian FederationSaudi ArabiaSenegalSerbiaSingaporeSlovak RepublicSloveniaSmall statesSouth AfricaSouth AsiaSouth Asia (IDA & IBRD)South SudanSpainSri LankaSub-Saharan Africa Sub-Saharan Africa (excluding high income)Sub-Saharan Africa (IDA & IBRD countries)SudanSwedenSwitzerlandSyrian Arab RepublicTajikistanTanzaniaThailandTogoTrinidad and TobagoTunisiaTurkeyTurkmenistanUkraineUnited Arab EmiratesUnited KingdomUnited StatesUpper middle incomeUruguayUzbekistanVenezuela, RBVietnamWorldYemen, Rep.ZambiaZimbabwe Timeline:
This timeline shows a graph from 1961 to 2015 of Belgium. No data until 1960. Number of actual observations by date: 55.
Source name:
World Development Indicators
Source organization:
IEA Statistics © OECD/IEA 2014 (http://www.iea.org/stats/index.asp), subject to https://www.iea.org/t&c/termsandconditions/
Categories, topics:
Energy & Mining, Climate Change, Environment
Last updated:
apr 23, 2017
Indicators value changes by year
Maximum:
16.901
jan 1, 2015
At the date of observation
Value
Absolute change
Change from previous value
jan 1, 1974
0.286
+0.286
%
jan 1, 1975
0.255
-0.03
-10.63%
jan 1, 1976
0.203
-0.052
-20.33%
jan 1, 1977
0.121
-0.082
-40.51%
jan 1, 1978
0.527
+0.406
335.68%
jan 1, 1979
0.514
-0.013
-2.42%
jan 1, 1980
0.607
+0.093
18.01%
jan 1, 1981
0.565
-0.042
-6.89%
jan 1, 1982
0.581
+0.016
2.89%
jan 1, 1983
0.092
-0.489
-84.17%
jan 1, 1984
0.042
-0.05
-53.92%
jan 1, 1985
0.045
+0.002
5.39%
jan 1, 1986
0.094
+0.05
110.75%
jan 1, 1987
0.207
+0.112
119.22%
jan 1, 1988
0.237
+0.031
14.98%
jan 1, 1989
0.291
+0.054
22.67%
jan 1, 1990
0.296
+0.005
1.64%
jan 1, 1991
0.411
+0.115
38.87%
jan 1, 1992
0.431
+0.02
4.89%
jan 1, 1993
0.387
-0.045
-10.38%
jan 1, 1994
0.361
-0.025
-6.58%
jan 1, 1995
0.356
-0.005
-1.4%
jan 1, 1996
0.449
+0.093
26.08%
jan 1, 1997
0.429
-0.02
-4.53%
jan 1, 1998
0.363
-0.065
-15.19%
jan 1, 1999
0.451
+0.087
24.03%
jan 1, 2000
0.611
+0.16
35.44%
jan 1, 2001
0.706
+0.095
15.56%
jan 1, 2002
0.806
+0.101
14.3%
jan 1, 2003
0.961
+0.155
19.19%
jan 1, 2004
1.131
+0.17
17.65%
jan 1, 2005
1.399
+0.268
23.7%
jan 1, 2006
2.121
+0.722
51.63%
jan 1, 2007
3.074
+0.953
44.93%
jan 1, 2008
3.538
+0.464
15.1%
jan 1, 2009
4.795
+1.257
35.52%
jan 1, 2010
5.692
+0.897
18.7%
jan 1, 2011
6.593
+0.901
15.84%
jan 1, 2012
9.191
+2.598
39.41%
jan 1, 2013
12.351
+3.16
34.38%
jan 1, 2014
13.624
+1.273
10.3%
jan 1, 2015
16.901
+3.277
24.05%
Ranking of countries by current statistics by years


Comments: